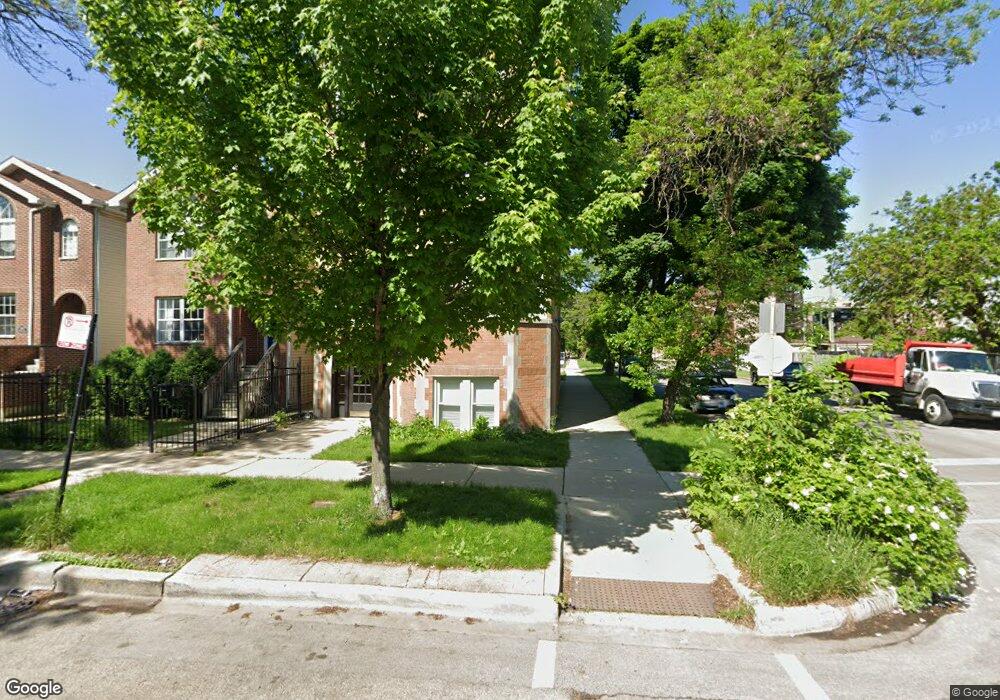
2056 N Sawyer Ave Unit 2A Chicago, IL 60647
Logan Square NeighborhoodEstimated Value: $188,000 - $349,000
1
Bed
1
Bath
900
Sq Ft
$288/Sq Ft
Est. Value
About This Home
This home is located at 2056 N Sawyer Ave Unit 2A, Chicago, IL 60647 and is currently estimated at $259,595, approximately $288 per square foot. 2056 N Sawyer Ave Unit 2A is a home located in Cook County with nearby schools including Frederick Funston Elementary School and Clemente Community Academy High School.
Ownership History
Date
Name
Owned For
Owner Type
Purchase Details
Closed on
Apr 3, 2014
Sold by
Wells Fargo Bank Na
Bought by
1117 Fry Llc
Current Estimated Value
Purchase Details
Closed on
Dec 12, 2013
Sold by
Rodriguez Jose L and Croteau Guy V
Bought by
Wells Fargo Bank Na
Purchase Details
Closed on
Mar 22, 2005
Sold by
Morrow Laura
Bought by
Rodriguez Jose L
Home Financials for this Owner
Home Financials are based on the most recent Mortgage that was taken out on this home.
Original Mortgage
$162,450
Interest Rate
4.52%
Mortgage Type
Negative Amortization
Purchase Details
Closed on
Oct 4, 2001
Sold by
2056 Sawyer Inc
Bought by
Morrow Laura
Home Financials for this Owner
Home Financials are based on the most recent Mortgage that was taken out on this home.
Original Mortgage
$111,920
Interest Rate
6.99%
Create a Home Valuation Report for This Property
The Home Valuation Report is an in-depth analysis detailing your home's value as well as a comparison with similar homes in the area
Home Values in the Area
Average Home Value in this Area
Purchase History
| Date | Buyer | Sale Price | Title Company |
|---|---|---|---|
| 1117 Fry Llc | $79,500 | Fnt | |
| Wells Fargo Bank Na | -- | None Available | |
| Rodriguez Jose L | $171,000 | First American Title | |
| Morrow Laura | $140,000 | Chicago Title Insurance Co |
Source: Public Records
Mortgage History
| Date | Status | Borrower | Loan Amount |
|---|---|---|---|
| Previous Owner | Rodriguez Jose L | $162,450 | |
| Previous Owner | Morrow Laura | $111,920 |
Source: Public Records
Tax History Compared to Growth
Tax History
| Year | Tax Paid | Tax Assessment Tax Assessment Total Assessment is a certain percentage of the fair market value that is determined by local assessors to be the total taxable value of land and additions on the property. | Land | Improvement |
|---|---|---|---|---|
| 2024 | $3,811 | $21,633 | $1,839 | $19,794 |
| 2023 | $3,715 | $18,000 | $1,491 | $16,509 |
| 2022 | $3,715 | $18,000 | $1,491 | $16,509 |
| 2021 | $3,631 | $17,999 | $1,490 | $16,509 |
| 2020 | $2,827 | $12,646 | $720 | $11,926 |
| 2019 | $2,863 | $14,199 | $720 | $13,479 |
| 2018 | $2,805 | $14,199 | $720 | $13,479 |
| 2017 | $2,819 | $13,094 | $646 | $12,448 |
| 2016 | $2,623 | $13,094 | $646 | $12,448 |
| 2015 | $2,576 | $14,055 | $646 | $13,409 |
| 2014 | $2,410 | $12,990 | $596 | $12,394 |
| 2013 | $3,219 | $17,699 | $596 | $17,103 |
Source: Public Records
Map
Nearby Homes
- 2025 N Sawyer Ave
- 3219 W Dickens Ave
- 2040 N Kedzie Ave Unit 2
- 3265 W Armitage Ave
- 2139 N Kedzie Blvd Unit 2
- 2137 N Kedzie Blvd Unit G
- 1939 N Sawyer Ave Unit G
- 1926 N Sawyer Ave
- 1928 N Kedzie Ave Unit 403
- 1928 N Kedzie Ave Unit 306
- 2121 N Saint Louis Ave Unit 3S
- 1918 N Kedzie Ave
- 2227 N Kimball Ave Unit 1E
- 3060 W Armitage Ave
- 3434 W Palmer St
- 2014 N Whipple St
- 2032 N Whipple St
- 3522 W Armitage Ave
- 3430 W Lyndale St
- 1902 N Albany Ave
- 2056 N Sawyer Ave Unit 3A
- 2056 N Sawyer Ave Unit 3A
- 2056 N Sawyer Ave Unit 2B
- 2056 N Sawyer Ave Unit 3B
- 2056 N Sawyer Ave Unit 1B
- 2056 N Sawyer Ave Unit G
- 2056 N Sawyer Ave Unit 1A
- 2054 N Sawyer Ave
- 2054 N Sawyer Ave
- 2052 N Sawyer Ave
- 2050 N Sawyer Ave
- 2048 N Sawyer Ave
- 2100 N Sawyer Ave
- 2102 N Sawyer Ave
- 2044 N Sawyer Ave
- 2108 N Sawyer Ave
- 2042 N Sawyer Ave Unit 2
- 2042 N Sawyer Ave Unit J02W
- 2042 N Sawyer Ave
- 2042 N Sawyer Ave