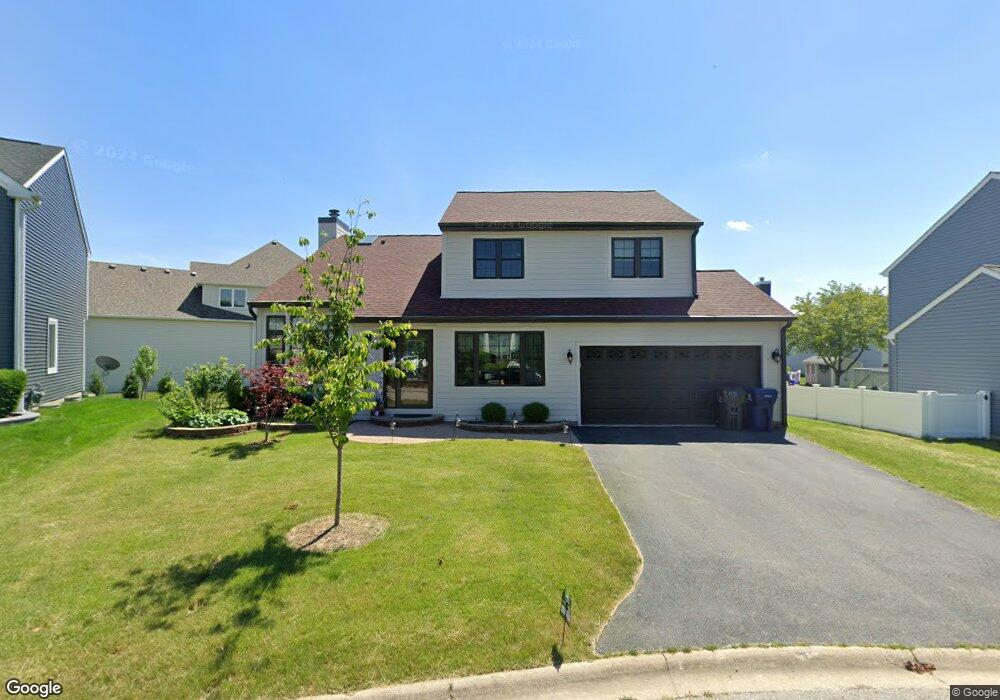
2056 Shady Grove Ct Naperville, IL 60565
Greene Valley NeighborhoodEstimated Value: $539,133 - $626,000
Studio
1
Bath
2,094
Sq Ft
$278/Sq Ft
Est. Value
About This Home
This home is located at 2056 Shady Grove Ct, Naperville, IL 60565 and is currently estimated at $582,533, approximately $278 per square foot. 2056 Shady Grove Ct is a home located in DuPage County with nearby schools including Ranch View Elementary School, Kennedy Junior High School, and Naperville Central High School.
Ownership History
Date
Name
Owned For
Owner Type
Purchase Details
Closed on
Jul 19, 2002
Sold by
Prudential Relocation Inc
Bought by
Dohadwala Khozem Z and Kanchwala Farida A
Current Estimated Value
Home Financials for this Owner
Home Financials are based on the most recent Mortgage that was taken out on this home.
Original Mortgage
$240,000
Interest Rate
6.7%
Purchase Details
Closed on
Nov 18, 1996
Sold by
Santiago David N and Santiago Victoria R
Bought by
Johnson William R and Johnson Rebecca A
Home Financials for this Owner
Home Financials are based on the most recent Mortgage that was taken out on this home.
Original Mortgage
$163,200
Interest Rate
7.62%
Create a Home Valuation Report for This Property
The Home Valuation Report is an in-depth analysis detailing your home's value as well as a comparison with similar homes in the area
Home Values in the Area
Average Home Value in this Area
Purchase History
| Date | Buyer | Sale Price | Title Company |
|---|---|---|---|
| Dohadwala Khozem Z | -- | -- | |
| Prudential Relocation Inc | $295,000 | -- | |
| Johnson William R | $204,000 | Attorneys Title Guaranty Fun |
Source: Public Records
Mortgage History
| Date | Status | Borrower | Loan Amount |
|---|---|---|---|
| Closed | Dohadwala Khozem Z | $240,000 | |
| Previous Owner | Johnson William R | $163,200 |
Source: Public Records
Tax History
| Year | Tax Paid | Tax Assessment Tax Assessment Total Assessment is a certain percentage of the fair market value that is determined by local assessors to be the total taxable value of land and additions on the property. | Land | Improvement |
|---|---|---|---|---|
| 2024 | $9,504 | $165,659 | $54,062 | $111,597 |
| 2023 | $9,158 | $148,930 | $49,340 | $99,590 |
| 2022 | $8,374 | $135,390 | $44,850 | $90,540 |
| 2021 | $8,066 | $130,270 | $43,150 | $87,120 |
| 2020 | $7,893 | $127,920 | $42,370 | $85,550 |
| 2019 | $7,661 | $122,390 | $40,540 | $81,850 |
| 2018 | $7,663 | $122,390 | $40,540 | $81,850 |
| 2017 | $7,507 | $118,260 | $39,170 | $79,090 |
| 2016 | $7,355 | $113,980 | $37,750 | $76,230 |
| 2015 | $7,305 | $107,340 | $35,550 | $71,790 |
| 2014 | $7,163 | $102,230 | $33,860 | $68,370 |
| 2013 | $7,055 | $102,470 | $33,940 | $68,530 |
Source: Public Records
Map
Nearby Homes
- 1896 Appaloosa Dr Unit 7
- 8S295 College Rd
- 23W731 Hobson Rd
- 23W711 Hobson Rd
- 24W141 Hobson Rd
- 8S230 Hampton Cir
- 1509 Shiva Ln
- 1653 Kenyon Dr
- 3805 Gladstone Dr
- 1405 E Bailey Rd
- 1404 Chelsea Ln
- 1864 Slippery Rock Rd
- 1255 E Bailey Rd
- 1909 Montclair Dr
- 7S460 Donwood Dr W
- 2504 Sun Valley Rd
- 1007 River Oak Dr
- 1333 Purdue Ave
- 1406 River Oak Dr
- 7S367 Augusta Ln
- 2060 Shady Grove Ct
- 2055 Steeplebrook Ct
- 2052 Shady Grove Ct
- 1403 Hatchwood Ct
- 1403 Hatchwood Ct
- 1403 Hatchwood Ct
- 2059 Shady Grove Ct
- 2064 Shady Grove Ct
- 2056 Steeplebrook Ct
- 2051 Steeplebrook Ct
- 2063 Shady Grove Ct
- 1407 Hatchwood Ct
- Lot 4 Hatchwood Ct
- 2059 Hollow Bend Ct
- 1407 Hatchwood Ct
- 2032 Cobblebrook Ln
- 2068 Shady Grove Ct
- 1404 Hatchwood Ct
- 2047 Cobblebrook Ln
- 2036 Cobblebrook Ln
Your Personal Tour Guide
Ask me questions while you tour the home.