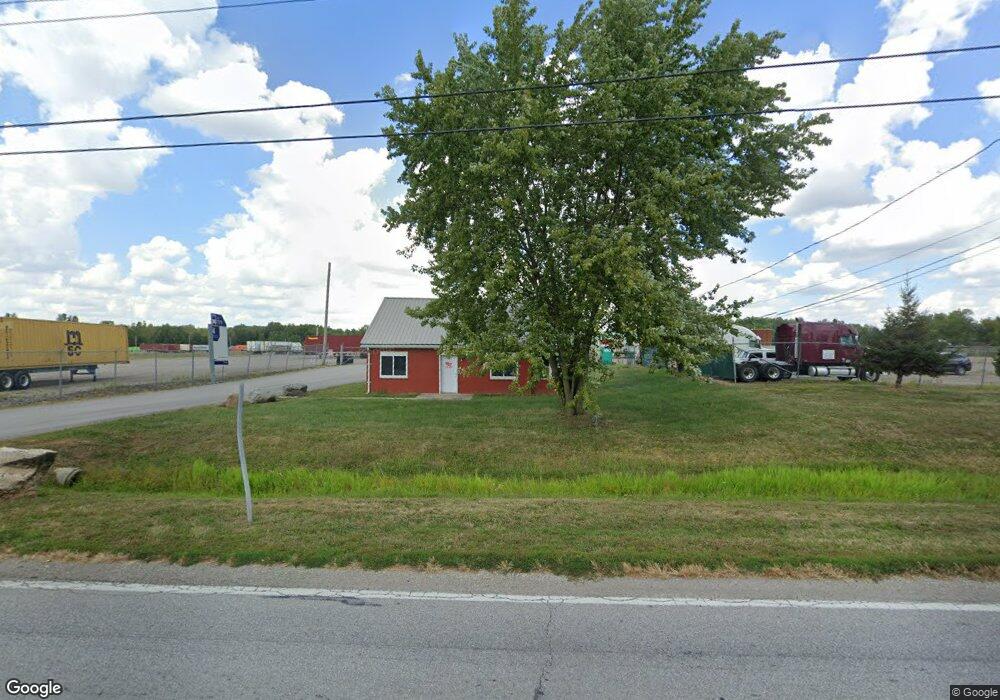
2056 Watkins Rd Columbus, OH 43207
Marion Franklin Neighborhood
3
Beds
2
Baths
7,488
Sq Ft
1.02
Acres
About This Home
This home is located at 2056 Watkins Rd, Columbus, OH 43207. 2056 Watkins Rd is a home located in Franklin County with nearby schools including Watkins Elementary School, Buckeye Middle School, and Marion-Franklin High School.
Ownership History
Date
Name
Owned For
Owner Type
Purchase Details
Closed on
Aug 13, 2014
Sold by
Wolfenbarger Guy and Wolfenbarger Carol
Bought by
Viking Real Estate Ltd
Purchase Details
Closed on
Dec 24, 2002
Sold by
Viking Properties
Bought by
Wolfenbarger Guy
Purchase Details
Closed on
Jan 23, 2001
Sold by
Saleh Hussein M
Bought by
Viking Properties
Purchase Details
Closed on
Oct 16, 2000
Sold by
L J Investments Co
Bought by
Viking Properties
Purchase Details
Closed on
Dec 3, 1999
Sold by
Pnt Investments
Bought by
Viking Properties
Purchase Details
Closed on
Mar 5, 1999
Sold by
Taub Samuel and Taub Alice
Bought by
L J Investment Co
Home Financials for this Owner
Home Financials are based on the most recent Mortgage that was taken out on this home.
Original Mortgage
$64,000
Interest Rate
6.46%
Mortgage Type
Seller Take Back
Purchase Details
Closed on
Feb 15, 1994
Bought by
Saleh Hussein M
Purchase Details
Closed on
Dec 6, 1991
Create a Home Valuation Report for This Property
The Home Valuation Report is an in-depth analysis detailing your home's value as well as a comparison with similar homes in the area
Home Values in the Area
Average Home Value in this Area
Purchase History
| Date | Buyer | Sale Price | Title Company |
|---|---|---|---|
| Viking Real Estate Ltd | -- | Connor Land Title Box | |
| Wolfenbarger Carol | -- | Connor Land Title Box | |
| Wolfenbarger Guy | $1,920,000 | Connor Land Title | |
| Viking Properties | $74,500 | Connor Land Title | |
| Viking Properties | $129,000 | Connor Land Title | |
| Viking Properties | $64,800 | Title First Agency Inc | |
| L J Investment Co | $80,000 | Independent Title | |
| Saleh Hussein M | $43,000 | -- | |
| -- | -- | -- |
Source: Public Records
Mortgage History
| Date | Status | Borrower | Loan Amount |
|---|---|---|---|
| Previous Owner | L J Investment Co | $64,000 |
Source: Public Records
Tax History Compared to Growth
Tax History
| Year | Tax Paid | Tax Assessment Tax Assessment Total Assessment is a certain percentage of the fair market value that is determined by local assessors to be the total taxable value of land and additions on the property. | Land | Improvement |
|---|---|---|---|---|
| 2024 | $45,275 | $408,590 | $229,180 | $179,410 |
| 2023 | $29,847 | $408,590 | $229,180 | $179,410 |
| 2022 | $26,415 | $352,240 | $197,680 | $154,560 |
| 2021 | $28,007 | $352,240 | $197,680 | $154,560 |
| 2020 | $26,347 | $352,240 | $197,680 | $154,560 |
| 2019 | $25,226 | $306,290 | $171,890 | $134,400 |
| 2018 | $25,299 | $306,290 | $171,890 | $134,400 |
| 2017 | $26,306 | $306,290 | $171,890 | $134,400 |
| 2016 | $27,414 | $315,010 | $171,890 | $143,120 |
| 2015 | $25,452 | $315,010 | $171,890 | $143,120 |
| 2014 | $25,441 | $315,010 | $171,890 | $143,120 |
| 2013 | $12,605 | $315,000 | $171,885 | $143,115 |
Source: Public Records
Map
Nearby Homes
- 0 Koebel Rd
- 2670 Meigs Dr
- 2674 Meigs Dr
- 2682 Meigs Dr
- 2681 Meigs Dr
- 2686 Meigs Dr
- 2685 Meigs Dr
- 2690 Meigs Dr
- 2689 Meigs Dr
- 2693 Meigs Dr
- 2697 Meigs Dr
- 1679 Burley Dr
- 3107 Huntington Dr
- 2711 Mchenry Dr
- 1471 Watkins Rd
- 2629 Patrick Henry Ave Unit 40
- 2715 Mchenry Dr
- 3242 Mackinac Dr
- 1684 Burley Dr
- 2723 Mchenry Dr
- 2167 Watkins Rd
- 2173 Watkins Rd
- 2179 Watkins Rd
- 2020 Watkins Rd
- 2149 Watkins Rd
- 2143 Watkins Rd
- 2191 Watkins Rd
- 2137 Watkins Rd
- 2197 Watkins Rd
- 2220 Watkins Rd
- 2203 Watkins Rd
- 2209 Watkins Rd
- 2131 Watkins Rd
- 2221 Watkins Rd
- 2227 Watkins Rd
- 2233 Watkins Rd
- 2233 Watkins Rd
- 2245 Watkins Rd
- 0 Watkins Rd
- 1649 Watkins Rd