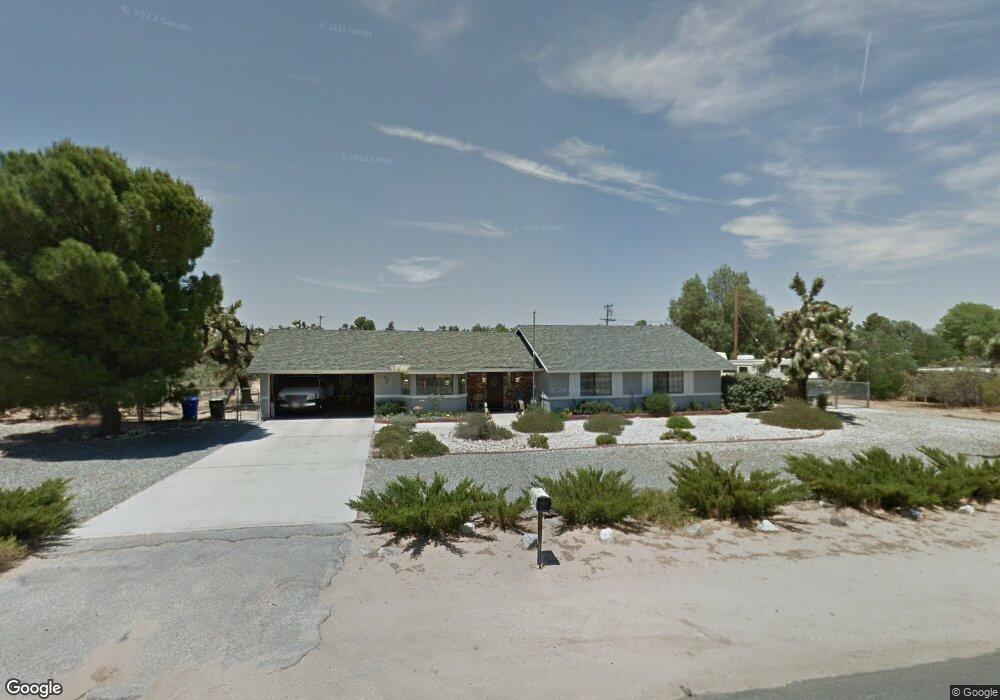
20566 Shawnee Rd Apple Valley, CA 92308
High Desert NeighborhoodEstimated Value: $396,108 - $431,000
3
Beds
2
Baths
1,524
Sq Ft
$274/Sq Ft
Est. Value
About This Home
This home is located at 20566 Shawnee Rd, Apple Valley, CA 92308 and is currently estimated at $417,027, approximately $273 per square foot. 20566 Shawnee Rd is a home located in San Bernardino County with nearby schools including Sitting Bull Academy and Apple Valley High School.
Ownership History
Date
Name
Owned For
Owner Type
Purchase Details
Closed on
Sep 14, 2001
Sold by
Eversole Carl Dean and Eversole Debra L
Bought by
Brockway Bruce L and Brockway Virginia L
Current Estimated Value
Purchase Details
Closed on
Nov 1, 2000
Sold by
Crackel Harold E and Crackel Doris L
Bought by
Vick Debra L
Home Financials for this Owner
Home Financials are based on the most recent Mortgage that was taken out on this home.
Original Mortgage
$88,000
Interest Rate
7.81%
Purchase Details
Closed on
Mar 12, 1999
Sold by
Hud
Bought by
Crackel Harold E and Crackel Doris L
Home Financials for this Owner
Home Financials are based on the most recent Mortgage that was taken out on this home.
Original Mortgage
$74,642
Interest Rate
6.73%
Mortgage Type
FHA
Purchase Details
Closed on
Jan 14, 1998
Sold by
Homeside Lending Inc
Bought by
Hud
Purchase Details
Closed on
Jan 9, 1998
Sold by
Cole Stacy L and Cole Maria A
Bought by
Homeside Lending Inc and Bancboston Mtg Corp
Create a Home Valuation Report for This Property
The Home Valuation Report is an in-depth analysis detailing your home's value as well as a comparison with similar homes in the area
Home Values in the Area
Average Home Value in this Area
Purchase History
| Date | Buyer | Sale Price | Title Company |
|---|---|---|---|
| Brockway Bruce L | $114,000 | Orange Coast Title | |
| Vick Debra L | $110,000 | United Title Company | |
| Crackel Harold E | $77,500 | Old Republic Title Company | |
| Hud | -- | Fidelity National Title Ins | |
| Homeside Lending Inc | $77,757 | Fidelity National Title Ins |
Source: Public Records
Mortgage History
| Date | Status | Borrower | Loan Amount |
|---|---|---|---|
| Previous Owner | Vick Debra L | $88,000 | |
| Previous Owner | Crackel Harold E | $74,642 |
Source: Public Records
Tax History
| Year | Tax Paid | Tax Assessment Tax Assessment Total Assessment is a certain percentage of the fair market value that is determined by local assessors to be the total taxable value of land and additions on the property. | Land | Improvement |
|---|---|---|---|---|
| 2025 | $1,972 | $168,414 | $36,932 | $131,482 |
| 2024 | $1,915 | $165,112 | $36,208 | $128,904 |
| 2023 | $1,896 | $161,874 | $35,498 | $126,376 |
| 2022 | $1,866 | $158,700 | $34,802 | $123,898 |
| 2021 | $1,822 | $155,589 | $34,120 | $121,469 |
| 2020 | $1,799 | $153,993 | $33,770 | $120,223 |
| 2019 | $1,764 | $150,974 | $33,108 | $117,866 |
| 2018 | $1,720 | $148,014 | $32,459 | $115,555 |
| 2017 | $1,694 | $145,112 | $31,823 | $113,289 |
| 2016 | $1,606 | $142,267 | $31,199 | $111,068 |
| 2015 | -- | $140,130 | $30,730 | $109,400 |
| 2014 | $1,275 | $112,700 | $23,000 | $89,700 |
Source: Public Records
Map
Nearby Homes
- 0 Shawnee Rd Unit HD25098149
- 20585 Yucca Loma Rd
- 13447 Iroquois Rd
- 20385 Eyota Rd
- 20865 Tonawanda Rd
- 13991 Falling Leaf Rd
- 13597 Kiowa Rd
- 20635 Tonawanda Rd
- 13206 Winona Rd
- 13099 Pocono Rd
- 13934 Okesa Rd
- 20357 Ituma Rd
- 20136 Ottawa Rd
- 21172 Burgundy Way
- 14010 Jicarilla Rd
- 13991 Jicarilla Rd
- 2222 Ottawa Rd
- 20190 Osseo Rd
- 0 Mohawk Rd Unit MB25110922
- 0 Mohawk Rd Unit IV26035395
- 20590 Shawnee Rd
- 0 Shawnee Rd Unit C08151215
- 0 Shawnee Rd Unit I09098156
- 0 Shawnee Rd Unit PW16169252
- 0 Shawnee Rd Unit CRHD25098149
- 0 Seminole Rd
- 0 Shawnee Rd Unit 416060
- 20565 Yucca Loma Rd
- 20532 Shawnee Rd
- 20567 Shawnee Rd
- 20531 Yucca Loma Rd
- 20591 Shawnee Rd
- 20612 Shawnee Rd
- 20531 Shawnee Rd
- 13598 Shawnee Rd
- 20510 Shawnee Rd
- 20615 Yucca Loma Rd
- 20611 Shawnee Rd
- 20511 Yucca Loma Rd
- 20515 Shawnee Rd
Your Personal Tour Guide
Ask me questions while you tour the home.