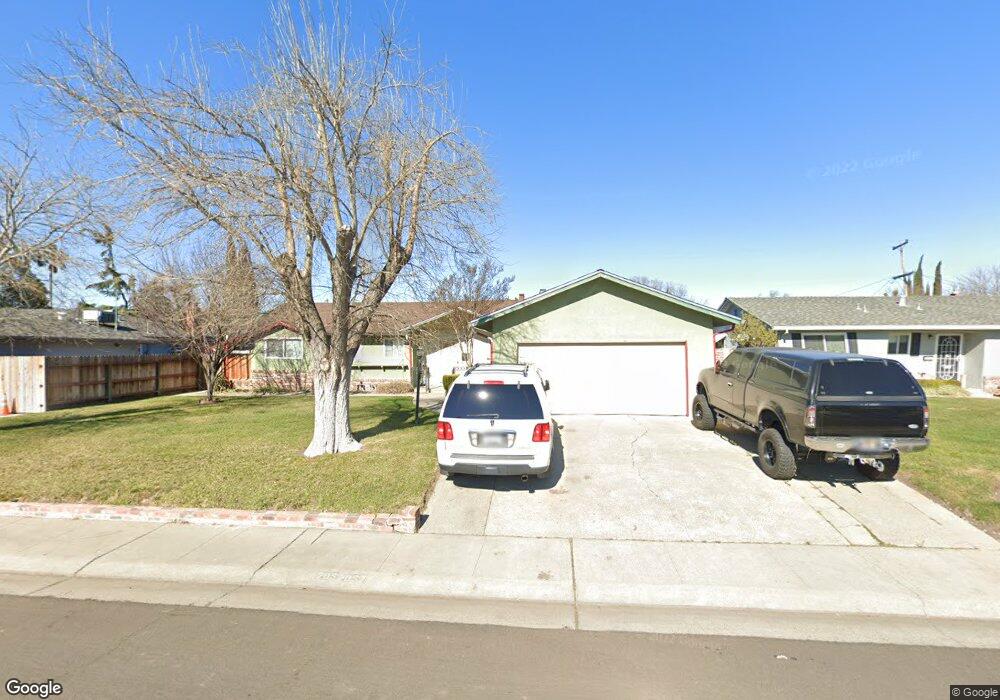
2057 San Gabriel Way Stockton, CA 95209
Colonial Heights NeighborhoodEstimated Value: $240,000 - $456,000
3
Beds
2
Baths
1,638
Sq Ft
$235/Sq Ft
Est. Value
About This Home
This home is located at 2057 San Gabriel Way, Stockton, CA 95209 and is currently estimated at $384,812, approximately $234 per square foot. 2057 San Gabriel Way is a home located in San Joaquin County with nearby schools including Colonial Heights School, Sierra Middle School, and Lincoln High School.
Ownership History
Date
Name
Owned For
Owner Type
Purchase Details
Closed on
Dec 10, 2002
Sold by
Barraza Margaret G and Barraza Clara Margaret
Bought by
Barraza Hector and Barraza Clara Margaret
Current Estimated Value
Home Financials for this Owner
Home Financials are based on the most recent Mortgage that was taken out on this home.
Original Mortgage
$175,500
Interest Rate
6.03%
Purchase Details
Closed on
Sep 14, 2001
Sold by
Barraza Margaret G
Bought by
Barraza Margaret G and Barraza Clara Margaret
Purchase Details
Closed on
Jan 19, 2000
Sold by
Barraza Clara Margaret
Bought by
Barraza Margaret G
Home Financials for this Owner
Home Financials are based on the most recent Mortgage that was taken out on this home.
Original Mortgage
$89,500
Interest Rate
7.37%
Purchase Details
Closed on
Aug 5, 1999
Sold by
Barraza Hectora and Barraza C
Bought by
Barraza Margaret G and Barraza Clara Margaret
Create a Home Valuation Report for This Property
The Home Valuation Report is an in-depth analysis detailing your home's value as well as a comparison with similar homes in the area
Home Values in the Area
Average Home Value in this Area
Purchase History
| Date | Buyer | Sale Price | Title Company |
|---|---|---|---|
| Barraza Hector | -- | First Amer Title Co | |
| Barraza Margaret G | -- | -- | |
| Barraza Margaret G | -- | Chicago Title Co | |
| Barraza Margaret G | -- | -- |
Source: Public Records
Mortgage History
| Date | Status | Borrower | Loan Amount |
|---|---|---|---|
| Closed | Barraza Hector | $175,500 | |
| Closed | Barraza Margaret G | $89,500 |
Source: Public Records
Tax History Compared to Growth
Tax History
| Year | Tax Paid | Tax Assessment Tax Assessment Total Assessment is a certain percentage of the fair market value that is determined by local assessors to be the total taxable value of land and additions on the property. | Land | Improvement |
|---|---|---|---|---|
| 2025 | $3,692 | $117,789 | $23,094 | $94,695 |
| 2024 | $3,615 | $115,481 | $22,642 | $92,839 |
| 2023 | $3,555 | $113,218 | $22,199 | $91,019 |
| 2022 | $3,436 | $110,999 | $21,764 | $89,235 |
| 2021 | $3,373 | $108,824 | $21,338 | $87,486 |
| 2020 | $3,330 | $107,709 | $21,120 | $86,589 |
| 2019 | $3,309 | $105,598 | $20,706 | $84,892 |
| 2018 | $3,228 | $103,528 | $20,300 | $83,228 |
| 2017 | $3,168 | $101,499 | $19,902 | $81,597 |
| 2016 | $2,966 | $99,510 | $19,512 | $79,998 |
| 2014 | $2,951 | $96,095 | $18,842 | $77,253 |
Source: Public Records
Map
Nearby Homes
- 2019 San Gabriel Way
- 8347 San Pablo Way
- 2112 Portola Ave
- 1816 Cortez Ave
- 1629 Cortez Ave
- 2417 Segarini Way
- 2454 Golden Bear Cir
- 8811 Davis Rd
- 1355 Paloma Ave
- 8011 N Pershing Ave
- 7724 Peppertree Dr Unit 10
- 7523 Oakcreek Dr
- 2640 Javete Way
- 7512 Heather Dr
- 1235 Briarwood Way
- 8324 Rothesay Place
- 8518 Burns Place
- 2708 Madrone Ave
- 1418 Woodcreek Way
- 7307 Woodside Dr
- 2043 San Gabriel Way
- 2069 San Gabriel Way
- 2056 Santa Rosa Way
- 2044 Santa Rosa Way
- 2068 Santa Rosa Way
- 2031 San Gabriel Way
- 2111 San Gabriel Way
- 2056 San Gabriel Way
- 2068 San Gabriel Way
- 2044 San Gabriel Way
- 2032 Santa Rosa Way
- 2112 San Gabriel Way
- 2123 San Gabriel Way
- 2032 San Gabriel Way
- 2020 Santa Rosa Way
- 2124 Santa Rosa Way
- 2124 San Gabriel Way
- 2057 Alcazar Way
- 2020 San Gabriel Way
- 2057 Santa Rosa Way