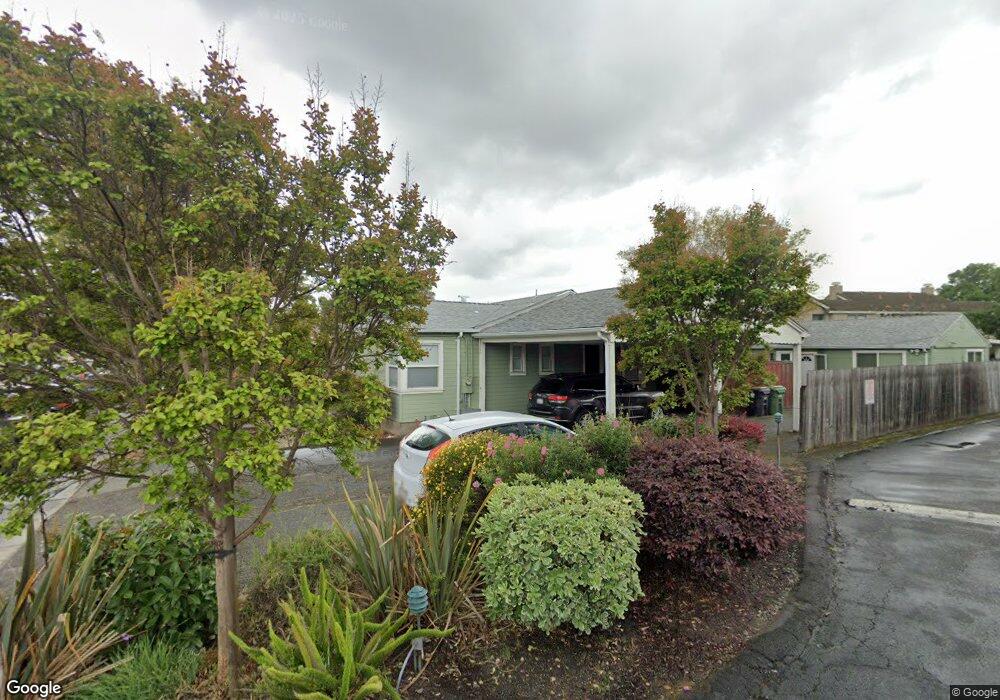
20575 Forest Ave Unit B Castro Valley, CA 94546
Castro Valley East NeighborhoodEstimated Value: $912,713 - $951,000
2
Beds
1
Bath
500
Sq Ft
$1,874/Sq Ft
Est. Value
About This Home
This home is located at 20575 Forest Ave Unit B, Castro Valley, CA 94546 and is currently estimated at $937,178, approximately $1,874 per square foot. 20575 Forest Ave Unit B is a home located in Alameda County with nearby schools including Marshall Elementary School, Creekside Middle School, and Canyon Middle School.
Ownership History
Date
Name
Owned For
Owner Type
Purchase Details
Closed on
Aug 8, 2025
Sold by
Carson Heritage Trust and Carson James J
Bought by
Chiang Shu Chun and Su Chunxia
Current Estimated Value
Home Financials for this Owner
Home Financials are based on the most recent Mortgage that was taken out on this home.
Original Mortgage
$640,000
Outstanding Balance
$639,440
Interest Rate
6.67%
Mortgage Type
New Conventional
Estimated Equity
$297,738
Purchase Details
Closed on
Apr 24, 2006
Sold by
Carson Kimberly Ann and Carson James J
Bought by
Carson James J and Carson Kimberly A
Purchase Details
Closed on
Oct 25, 2002
Sold by
Carson Kimberly Ann
Bought by
Carson James J and Carson Kimberly Ann
Home Financials for this Owner
Home Financials are based on the most recent Mortgage that was taken out on this home.
Original Mortgage
$230,000
Interest Rate
5.99%
Purchase Details
Closed on
Oct 25, 2001
Sold by
Carson Kimberly Ann and Trust Estate Of Lucille C Swar
Bought by
Carson Kimberly Ann
Create a Home Valuation Report for This Property
The Home Valuation Report is an in-depth analysis detailing your home's value as well as a comparison with similar homes in the area
Home Values in the Area
Average Home Value in this Area
Purchase History
| Date | Buyer | Sale Price | Title Company |
|---|---|---|---|
| Chiang Shu Chun | $950,000 | Old Republic Title Company | |
| Carson James J | -- | None Available | |
| Carson James J | -- | Fidelity National Title Co | |
| Carson Kimberly Ann | -- | -- |
Source: Public Records
Mortgage History
| Date | Status | Borrower | Loan Amount |
|---|---|---|---|
| Open | Chiang Shu Chun | $640,000 | |
| Previous Owner | Carson James J | $230,000 |
Source: Public Records
Tax History Compared to Growth
Tax History
| Year | Tax Paid | Tax Assessment Tax Assessment Total Assessment is a certain percentage of the fair market value that is determined by local assessors to be the total taxable value of land and additions on the property. | Land | Improvement |
|---|---|---|---|---|
| 2025 | $3,778 | $108,166 | $65,380 | $42,786 |
| 2024 | $3,778 | $106,045 | $64,098 | $41,947 |
| 2023 | $3,120 | $103,966 | $62,842 | $41,124 |
| 2022 | $3,028 | $101,928 | $61,610 | $40,318 |
| 2021 | $2,553 | $99,929 | $60,402 | $39,527 |
| 2020 | $3,275 | $98,904 | $59,782 | $39,122 |
| 2019 | $3,378 | $96,965 | $58,610 | $38,355 |
| 2018 | $3,289 | $95,064 | $57,461 | $37,603 |
| 2017 | $3,176 | $93,201 | $56,335 | $36,866 |
| 2016 | $3,059 | $91,373 | $55,230 | $36,143 |
| 2015 | $2,861 | $90,000 | $54,400 | $35,600 |
| 2014 | $2,711 | $88,238 | $53,335 | $34,903 |
Source: Public Records
Map
Nearby Homes
- 3767 Castro Valley Blvd
- 3769 Castro Valley Blvd
- 3775 Castro Valley Blvd
- 3824 Norbridge Ave
- Plan 1714 at The Chapter
- Plan 1582 at The Chapter
- Plan 1660 at The Chapter
- Plan 1606 at The Chapter
- Plan 1495 at The Chapter
- Plan 1705 at The Chapter
- Plan 1423 Modeled at The Chapter
- Plan 1749 Modeled at The Chapter
- 3710 Scribe Way
- 21061 Story St
- 3826 Norbridge Ave
- 3838 Norbridge Ave
- 3913 Castro Valley Blvd Unit 39
- 3998 Castro Valley Blvd Unit 34
- 3998 Castro Valley Blvd Unit SPC 27
- 3414 Pine St
- 20575 Forest Ave Unit C
- 20671 Forest Ave
- 20642 Maria Ct
- 20638 Maria Ct
- 20673 Forest Ave Unit C
- 20634 Maria Ct
- 20646 Maria Ct
- 20650 Maria Ct
- 20635 Maria Ct
- 20675 Forest Ave
- 20553 Forest Ave
- 20658 Maria Ct
- 20654 Maria Ct
- 20639 Maria Ct
- 20556 Forest Ave
- 20651 Maria Ct
- 20670 Forest Ave
- 20643 Maria Ct
- 20662 Maria Ct
- 20554 Forest Ave