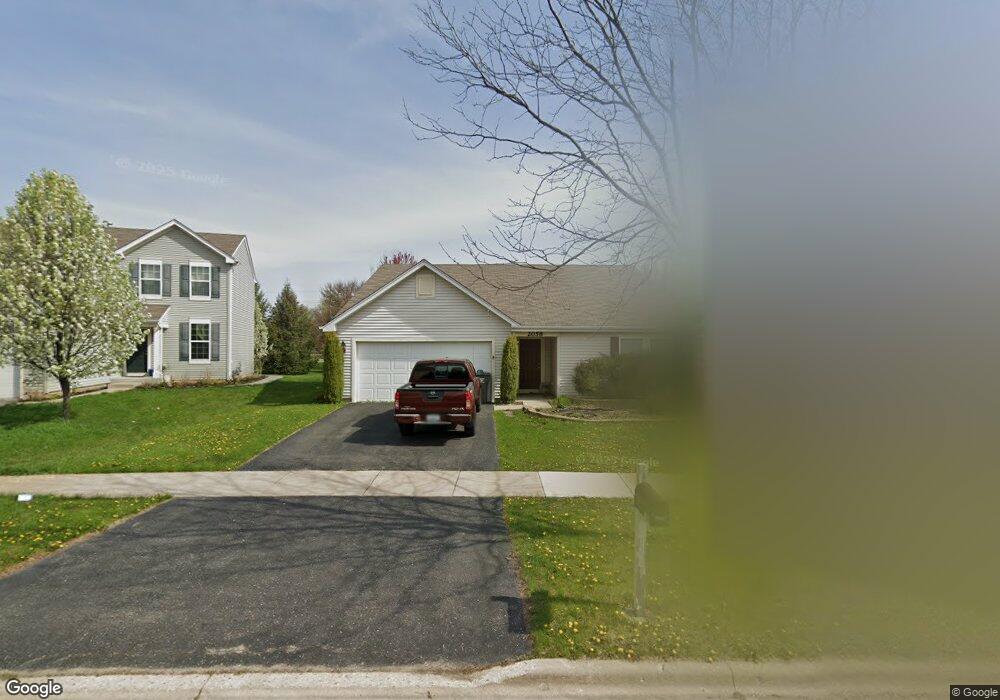
2058 Kate Dr Montgomery, IL 60538
South Montgomery NeighborhoodEstimated Value: $306,000 - $368,000
3
Beds
2
Baths
1,805
Sq Ft
$192/Sq Ft
Est. Value
About This Home
This home is located at 2058 Kate Dr, Montgomery, IL 60538 and is currently estimated at $346,321, approximately $191 per square foot. 2058 Kate Dr is a home located in Kendall County with nearby schools including Lakewood Creek Elementary School, Thompson Jr. High School, and Oswego High School.
Ownership History
Date
Name
Owned For
Owner Type
Purchase Details
Closed on
Dec 1, 2017
Sold by
Myers Bebecca M
Bought by
Skelly Jeremy D
Current Estimated Value
Home Financials for this Owner
Home Financials are based on the most recent Mortgage that was taken out on this home.
Original Mortgage
$194,750
Outstanding Balance
$164,719
Interest Rate
4.12%
Mortgage Type
New Conventional
Estimated Equity
$181,602
Purchase Details
Closed on
May 11, 2012
Sold by
Drh Cambridge Homes Inc
Bought by
Myers Rebecca M
Home Financials for this Owner
Home Financials are based on the most recent Mortgage that was taken out on this home.
Original Mortgage
$165,633
Interest Rate
3.75%
Mortgage Type
FHA
Purchase Details
Closed on
Jun 22, 2010
Sold by
Orchard Prairie North Llc
Bought by
Drh Cambridge Homes Inc
Create a Home Valuation Report for This Property
The Home Valuation Report is an in-depth analysis detailing your home's value as well as a comparison with similar homes in the area
Home Values in the Area
Average Home Value in this Area
Purchase History
| Date | Buyer | Sale Price | Title Company |
|---|---|---|---|
| Skelly Jeremy D | $205,000 | None Available | |
| Myers Rebecca M | $169,000 | Chicago Title Insurance Co | |
| Drh Cambridge Homes Inc | $306,000 | Chicago Title Insurance Co |
Source: Public Records
Mortgage History
| Date | Status | Borrower | Loan Amount |
|---|---|---|---|
| Open | Skelly Jeremy D | $194,750 | |
| Previous Owner | Myers Rebecca M | $165,633 |
Source: Public Records
Tax History
| Year | Tax Paid | Tax Assessment Tax Assessment Total Assessment is a certain percentage of the fair market value that is determined by local assessors to be the total taxable value of land and additions on the property. | Land | Improvement |
|---|---|---|---|---|
| 2024 | $7,895 | $98,844 | $10,241 | $88,603 |
| 2023 | $7,106 | $88,436 | $9,163 | $79,273 |
| 2022 | $7,106 | $80,287 | $8,319 | $71,968 |
| 2021 | $6,872 | $75,579 | $8,319 | $67,260 |
| 2020 | $6,654 | $72,376 | $8,319 | $64,057 |
| 2019 | $6,476 | $69,599 | $8,000 | $61,599 |
| 2018 | $6,169 | $63,463 | $8,000 | $55,463 |
| 2017 | $5,658 | $57,082 | $8,000 | $49,082 |
| 2016 | $5,389 | $53,615 | $8,000 | $45,615 |
| 2015 | $5,560 | $52,569 | $7,204 | $45,365 |
| 2014 | -- | $52,569 | $7,204 | $45,365 |
| 2013 | -- | $52,569 | $7,204 | $45,365 |
Source: Public Records
Map
Nearby Homes
- 2031 Matthew Dr Unit 1
- 2468 Roxbury Ln
- 2492 Concord Ct
- 319 Grape Vine Trail
- 19 Pasadena Dr
- 2418 Montclair Ln Unit 7
- 4476 E Millbrook Cir
- 2101 Chad Ln
- 1709 Wick Way
- 2091 Jericho Rd
- 424 Grape Vine Trail
- 2978 Fairfield Way
- 2785 Gains Ct
- 1836 Ness Way Unit DAY
- 1 Highway 30
- 3014 Shetland Ln
- 3051 Patterson Rd
- 2021 Radcliffe Dr
- 5.43 B-3 Commercial State Route 31
- 6 E Anchor Dr
Your Personal Tour Guide
Ask me questions while you tour the home.