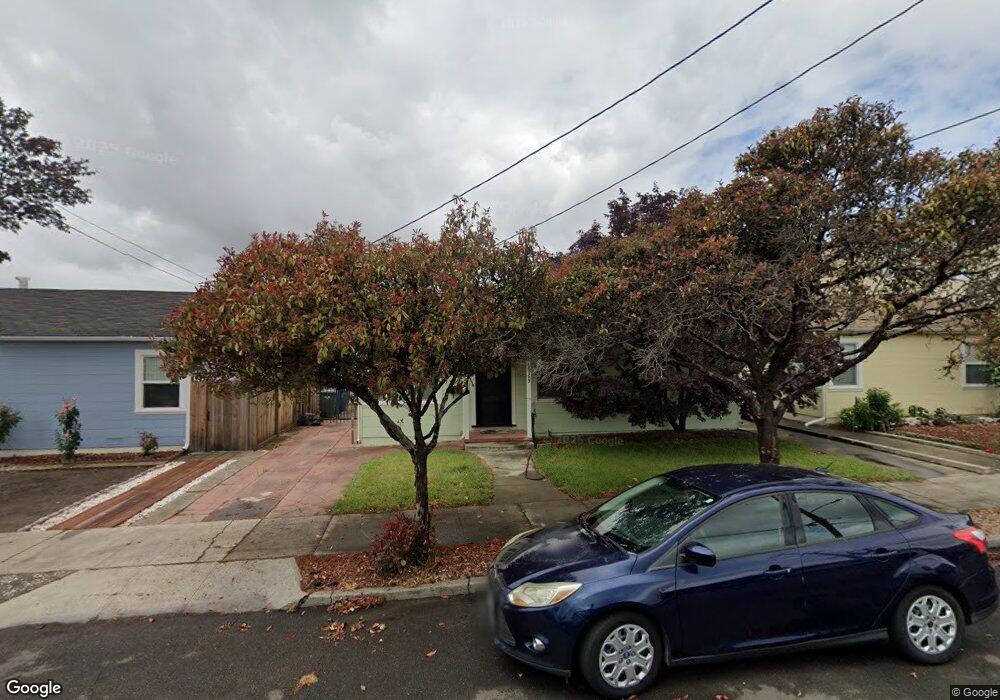
2059 Clarke St San Leandro, CA 94577
Old San Leandro NeighborhoodEstimated Value: $628,272 - $735,000
3
Beds
1
Bath
936
Sq Ft
$740/Sq Ft
Est. Value
About This Home
This home is located at 2059 Clarke St, San Leandro, CA 94577 and is currently estimated at $693,068, approximately $740 per square foot. 2059 Clarke St is a home located in Alameda County with nearby schools including McKinley Elementary School, Bancroft Middle School, and San Leandro High School.
Ownership History
Date
Name
Owned For
Owner Type
Purchase Details
Closed on
Sep 24, 2024
Sold by
Callaghan-Sander Rilia M and Sander Joseph G
Bought by
Callaghan-Sander Trust and Callaghan-Sander
Current Estimated Value
Purchase Details
Closed on
Feb 11, 2012
Sold by
Sander Joseph G and Callaghan Sander Rilia M
Bought by
Callaghan Sander Rilia M and Sander Joseph G
Home Financials for this Owner
Home Financials are based on the most recent Mortgage that was taken out on this home.
Original Mortgage
$280,315
Interest Rate
3.86%
Mortgage Type
New Conventional
Purchase Details
Closed on
Apr 17, 1998
Sold by
Callahan Eddy A and Sander Joseph George
Bought by
Sander Joseph G and Callaghan Sander Rilia M
Home Financials for this Owner
Home Financials are based on the most recent Mortgage that was taken out on this home.
Original Mortgage
$64,500
Interest Rate
7.15%
Purchase Details
Closed on
Jan 17, 1998
Sold by
Callaghan Eddy A
Bought by
Callahan Eddy A and Sander Joseph George
Create a Home Valuation Report for This Property
The Home Valuation Report is an in-depth analysis detailing your home's value as well as a comparison with similar homes in the area
Home Values in the Area
Average Home Value in this Area
Purchase History
| Date | Buyer | Sale Price | Title Company |
|---|---|---|---|
| Callaghan-Sander Trust | -- | None Listed On Document | |
| Callaghan-Sander Trust | -- | None Listed On Document | |
| Callaghan Sander Rilia M | -- | First American Title | |
| Sander Joseph G | $21,500 | Fidelity National Title Co | |
| Callahan Eddy A | -- | -- |
Source: Public Records
Mortgage History
| Date | Status | Borrower | Loan Amount |
|---|---|---|---|
| Previous Owner | Callaghan Sander Rilia M | $280,315 | |
| Previous Owner | Sander Joseph G | $64,500 |
Source: Public Records
Tax History Compared to Growth
Tax History
| Year | Tax Paid | Tax Assessment Tax Assessment Total Assessment is a certain percentage of the fair market value that is determined by local assessors to be the total taxable value of land and additions on the property. | Land | Improvement |
|---|---|---|---|---|
| 2025 | $1,748 | $68,409 | $46,424 | $28,985 |
| 2024 | $1,748 | $66,931 | $45,514 | $28,417 |
| 2023 | $1,681 | $72,481 | $44,621 | $27,860 |
| 2022 | $1,634 | $64,059 | $43,746 | $27,313 |
| 2021 | $1,545 | $62,667 | $42,889 | $26,778 |
| 2020 | $1,472 | $68,952 | $42,449 | $26,503 |
| 2019 | $1,437 | $67,601 | $41,617 | $25,984 |
| 2018 | $1,371 | $66,275 | $40,801 | $25,474 |
| 2017 | $1,378 | $64,976 | $40,001 | $24,975 |
| 2016 | $1,318 | $63,701 | $39,216 | $24,485 |
| 2015 | $1,294 | $62,744 | $38,627 | $24,117 |
| 2014 | $1,276 | $61,516 | $37,871 | $23,645 |
Source: Public Records
Map
Nearby Homes
- 341 Castro St
- 2077 Washington Ave Unit 114
- 2077 Washington Ave Unit 111
- 2101 Washington Ave
- 1854 Hays St
- 2062 Washington Ave
- 736 Castro St
- 1659 Washington Ave
- 1639 Washington Ave
- 65 Thornton St
- 398 Parrott St Unit 302
- 1599 Hays St Unit 306
- 2460 Dundee Ct
- 2470 Washington Ave Unit SPC 11
- 2378 Cheshire Place
- 1400 Carpentier St Unit 225
- 1400 Carpentier St Unit 405
- 1400 Carpentier St Unit 325
- 348 Maud Ave
- 2399 E 14th St Unit 143
- 2077 Clarke St
- 2041 Clarke St
- 426 Estabrook St
- 2095 Clarke St
- 2023 Clarke St
- 438 Estabrook St
- 392 Estabrook St
- 433 Harlan St
- 433 Harlan St Unit 304
- 433 Harlan St Unit 204
- 433 Harlan St Unit 104
- 433 Harlan St Unit 303
- 433 Harlan St Unit 203
- 433 Harlan St Unit 103
- 433 Harlan St Unit 302
- 433 Harlan St Unit 202
- 433 Harlan St Unit 102
- 433 Harlan St Unit 301
- 433 Harlan St Unit 201
- 433 Harlan St Unit 101