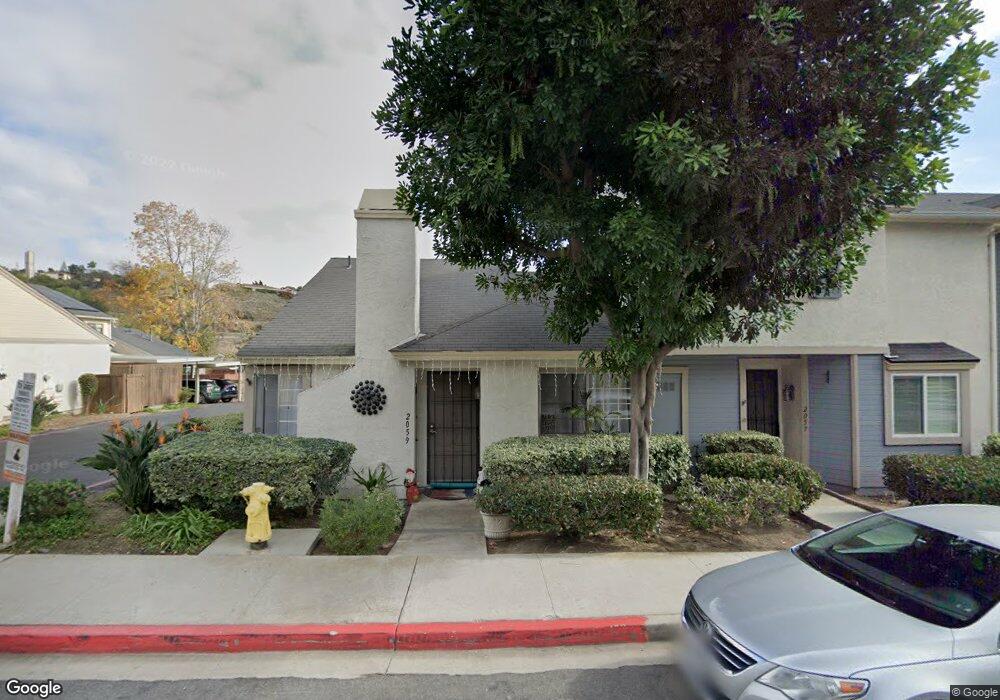
2059 Haller St San Diego, CA 92104
North Park NeighborhoodEstimated Value: $496,000 - $685,000
2
Beds
1
Bath
874
Sq Ft
$663/Sq Ft
Est. Value
About This Home
This home is located at 2059 Haller St, San Diego, CA 92104 and is currently estimated at $579,565, approximately $663 per square foot. 2059 Haller St is a home located in San Diego County with nearby schools including McKinley Elementary School, Roosevelt International Middle School, and Mcgill School Of Success.
Ownership History
Date
Name
Owned For
Owner Type
Purchase Details
Closed on
Sep 29, 2021
Sold by
Davis Luanne
Bought by
Davis Luanne and Baca Katherine Mccormick
Current Estimated Value
Home Financials for this Owner
Home Financials are based on the most recent Mortgage that was taken out on this home.
Original Mortgage
$258,000
Outstanding Balance
$235,272
Interest Rate
2.8%
Mortgage Type
New Conventional
Estimated Equity
$344,293
Purchase Details
Closed on
May 30, 2006
Sold by
Weller Jason and Weller Kara
Bought by
Davis Luanne
Home Financials for this Owner
Home Financials are based on the most recent Mortgage that was taken out on this home.
Original Mortgage
$255,200
Interest Rate
6.55%
Mortgage Type
Fannie Mae Freddie Mac
Purchase Details
Closed on
Jan 28, 2005
Sold by
Weller Jason and Weller Kara
Bought by
Weller Jason and Weller Kara
Home Financials for this Owner
Home Financials are based on the most recent Mortgage that was taken out on this home.
Original Mortgage
$250,000
Interest Rate
5.12%
Mortgage Type
New Conventional
Purchase Details
Closed on
Sep 2, 2004
Sold by
Weller Kara A B and Braniff Kara A
Bought by
Weller Jason and Weller Kara
Purchase Details
Closed on
Mar 7, 2003
Sold by
Sullivan Mary J
Bought by
Braniff Kara A
Home Financials for this Owner
Home Financials are based on the most recent Mortgage that was taken out on this home.
Original Mortgage
$186,400
Interest Rate
4.12%
Purchase Details
Closed on
Aug 4, 2000
Sold by
Smith Amir O and Smith Treci A
Bought by
Sullivan Mary J
Home Financials for this Owner
Home Financials are based on the most recent Mortgage that was taken out on this home.
Original Mortgage
$112,765
Interest Rate
7.5%
Purchase Details
Closed on
Aug 22, 1995
Sold by
Smith Amir O
Bought by
Smith Amir O and Smith Treci A
Home Financials for this Owner
Home Financials are based on the most recent Mortgage that was taken out on this home.
Original Mortgage
$20,000
Interest Rate
7.5%
Purchase Details
Closed on
May 31, 1994
Sold by
Preble Francis V and Mills Lisa A
Bought by
Smith Amir O
Home Financials for this Owner
Home Financials are based on the most recent Mortgage that was taken out on this home.
Original Mortgage
$89,621
Interest Rate
8.38%
Mortgage Type
FHA
Purchase Details
Closed on
Nov 27, 1985
Create a Home Valuation Report for This Property
The Home Valuation Report is an in-depth analysis detailing your home's value as well as a comparison with similar homes in the area
Home Values in the Area
Average Home Value in this Area
Purchase History
| Date | Buyer | Sale Price | Title Company |
|---|---|---|---|
| Davis Luanne | -- | Lawyers Title | |
| Davis Luanne | $319,000 | Old Republic Title Company | |
| Weller Jason | -- | Fidelity National Title Co | |
| Weller Jason | -- | -- | |
| Braniff Kara A | $233,000 | Commerce Title Company | |
| Sullivan Mary J | $119,000 | Benefit Land Title Company | |
| Smith Amir O | -- | Fidelity National Title | |
| Smith Amir O | $90,000 | Union Land Title Co | |
| -- | $73,000 | -- |
Source: Public Records
Mortgage History
| Date | Status | Borrower | Loan Amount |
|---|---|---|---|
| Open | Davis Luanne | $258,000 | |
| Previous Owner | Davis Luanne | $255,200 | |
| Previous Owner | Weller Jason | $250,000 | |
| Previous Owner | Braniff Kara A | $186,400 | |
| Previous Owner | Sullivan Mary J | $112,765 | |
| Previous Owner | Smith Amir O | $20,000 | |
| Previous Owner | Smith Amir O | $89,621 | |
| Closed | Braniff Kara A | $23,300 |
Source: Public Records
Tax History Compared to Growth
Tax History
| Year | Tax Paid | Tax Assessment Tax Assessment Total Assessment is a certain percentage of the fair market value that is determined by local assessors to be the total taxable value of land and additions on the property. | Land | Improvement |
|---|---|---|---|---|
| 2025 | $4,882 | $409,939 | $191,305 | $218,634 |
| 2024 | $4,882 | $401,902 | $187,554 | $214,348 |
| 2023 | $4,772 | $394,023 | $183,877 | $210,146 |
| 2022 | $4,644 | $386,298 | $180,272 | $206,026 |
| 2021 | $4,611 | $378,725 | $176,738 | $201,987 |
| 2020 | $4,372 | $360,000 | $115,000 | $245,000 |
| 2019 | $4,256 | $350,000 | $112,000 | $238,000 |
| 2018 | $4,059 | $350,000 | $112,000 | $238,000 |
| 2017 | $80 | $300,000 | $96,000 | $204,000 |
| 2016 | $2,999 | $260,000 | $84,000 | $176,000 |
| 2015 | $2,647 | $230,000 | $75,000 | $155,000 |
| 2014 | $2,481 | $215,000 | $71,000 | $144,000 |
Source: Public Records
Map
Nearby Homes
- 2035 Haller St
- 2170 Montclair St
- 1742 Rowan St
- 1804 Colonial Ave
- 2382 Haller St
- 2280-82 Pentuckett Ave
- 3171 3175 K St
- 441 443 N 41st St
- 348 & 350 27th St
- 2215 Marigold Place
- 1720 Midvale Dr
- 1505 Bridgeview Dr
- 1480 Bridgeview Dr
- 3688 Cactusview Dr
- 2541 Haller St
- 3606 Maple St Unit 12
- 2609 Montclair St Unit 11
- 2661 Montclair St
- 4216 Posey Place
- 2317 Shamrock St Unit 3
- 2057 Haller St
- 2055 Haller St
- 2061 Haller St
- 2053 Haller St
- 2063 Haller St
- 2073 Haller St
- 2065 Haller St
- 2047 Haller St
- 2045 Haller St
- 2051 Haller St
- 2075 Haller St
- 2071 Haller St
- 2043 Haller St
- 2049 Haller St
- 2077 Haller St
- 2069 Haller St
- 2067 Haller St
- 2065 Montclair St
- 2091 Haller St
- 2113 Becky Place