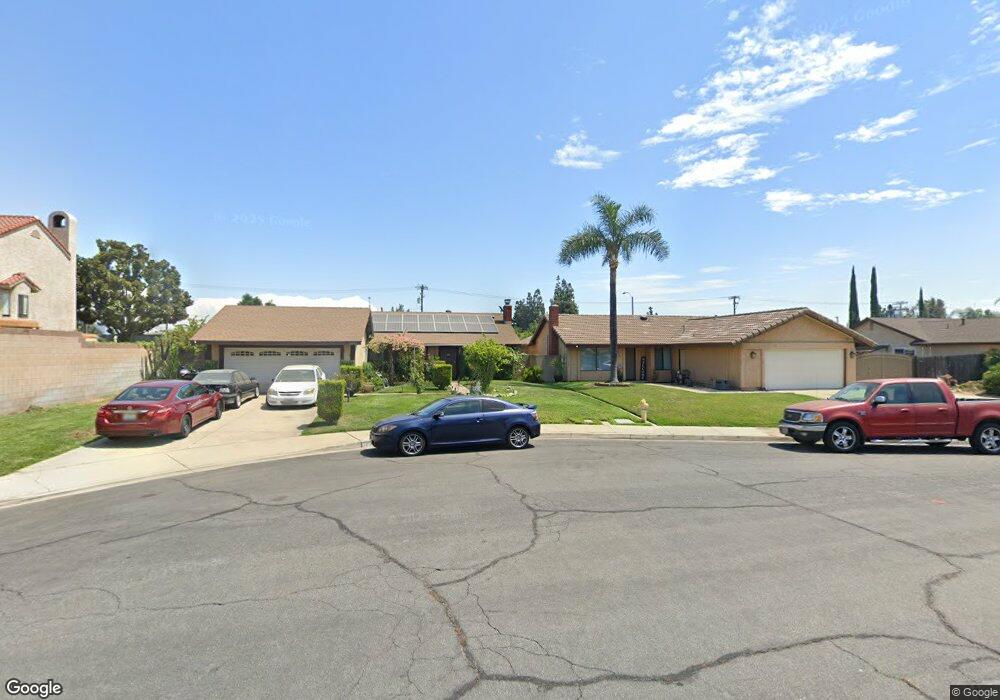
2059 S Hope Place Ontario, CA 91761
Downtown Ontario NeighborhoodEstimated Value: $688,000 - $800,000
3
Beds
2
Baths
1,641
Sq Ft
$438/Sq Ft
Est. Value
About This Home
This home is located at 2059 S Hope Place, Ontario, CA 91761 and is currently estimated at $717,975, approximately $437 per square foot. 2059 S Hope Place is a home located in San Bernardino County with nearby schools including Bon View Elementary, De Anza Middle, and Ontario High School.
Ownership History
Date
Name
Owned For
Owner Type
Purchase Details
Closed on
May 4, 1998
Sold by
Barragan Mariana and Barragan Elizabeth
Bought by
Moreno Roberto and Moreno Elizabeth
Current Estimated Value
Home Financials for this Owner
Home Financials are based on the most recent Mortgage that was taken out on this home.
Original Mortgage
$95,000
Outstanding Balance
$18,611
Interest Rate
7.13%
Estimated Equity
$699,364
Purchase Details
Closed on
Feb 8, 1997
Sold by
Barragan Mariana
Bought by
Moreno Elizabeth and Moreno Roberto
Purchase Details
Closed on
Dec 18, 1995
Sold by
Barragan Elizabeth
Bought by
Moreno Elizabeth and Moreno Roberto
Purchase Details
Closed on
Mar 23, 1995
Sold by
Guardalabene Michael Edward
Bought by
Barragan Elizabeth and Barragan Mariana
Home Financials for this Owner
Home Financials are based on the most recent Mortgage that was taken out on this home.
Original Mortgage
$94,000
Interest Rate
8.44%
Create a Home Valuation Report for This Property
The Home Valuation Report is an in-depth analysis detailing your home's value as well as a comparison with similar homes in the area
Home Values in the Area
Average Home Value in this Area
Purchase History
| Date | Buyer | Sale Price | Title Company |
|---|---|---|---|
| Moreno Roberto | -- | Fidelity National Title Co | |
| Moreno Elizabeth | -- | -- | |
| Moreno Elizabeth | -- | -- | |
| Barragan Elizabeth | $117,500 | Old Republic Title Co |
Source: Public Records
Mortgage History
| Date | Status | Borrower | Loan Amount |
|---|---|---|---|
| Open | Moreno Roberto | $95,000 | |
| Previous Owner | Barragan Elizabeth | $94,000 | |
| Closed | Barragan Elizabeth | $20,125 |
Source: Public Records
Tax History Compared to Growth
Tax History
| Year | Tax Paid | Tax Assessment Tax Assessment Total Assessment is a certain percentage of the fair market value that is determined by local assessors to be the total taxable value of land and additions on the property. | Land | Improvement |
|---|---|---|---|---|
| 2025 | $2,447 | $229,842 | $67,859 | $161,983 |
| 2024 | $2,447 | $225,335 | $66,528 | $158,807 |
| 2023 | $2,378 | $220,917 | $65,224 | $155,693 |
| 2022 | $2,346 | $216,585 | $63,945 | $152,640 |
| 2021 | $2,330 | $212,338 | $62,691 | $149,647 |
| 2020 | $2,289 | $210,161 | $62,048 | $148,113 |
| 2019 | $2,268 | $206,040 | $60,831 | $145,209 |
| 2018 | $2,236 | $202,000 | $59,638 | $142,362 |
| 2017 | $2,156 | $198,040 | $58,469 | $139,571 |
| 2016 | $2,071 | $194,157 | $57,323 | $136,834 |
| 2015 | $2,056 | $191,241 | $56,462 | $134,779 |
| 2014 | $1,993 | $187,495 | $55,356 | $132,139 |
Source: Public Records
Map
Nearby Homes
- 840 E Cedar St
- 2030 S Bon View Ave Unit G
- 2119 S Phoenix Place
- 2001 S Campus Ave Unit 7F
- 4235 S Gasly Paseo
- 0 Vineyard Unit CV25067044
- 4245 S Grasly Paseo
- 4233 S Grasly Paseo
- 0 Phillips Unit CV23180894
- 2408 S Taylor Place
- 2437 S Garfield Place
- 2148 S Sultana Ave
- 2300 S Sultana Ave Unit 298
- 304 E Cedar St
- 1650 S Campus Ave Unit 21
- 1650 S Campus Ave Unit 20
- 513 E Fairfield Ct
- 2453 S Marigold Place
- 310 E Philadelphia St Unit 35
- 310 E Philadelphia St
- 2065 S Hope Place
- 2053 S Hope Place
- 2046 S Bon View Ave
- 2046 S Bon View Ave Unit B
- 2046 S Bon View Ave Unit A
- 2046 S Bon View Ave Unit E
- 2046 S Bon View Ave Unit C
- 2046 S Bon View Ave Unit D
- 2046 S Bon View Ave Unit F
- 2046 S Bon View Ave Unit G
- 2075 S Hope Place
- 2060 S Hope Place
- 2064 S Hope Place
- 2048 S Bon View Ave
- 2048 S Bon View Ave Unit G
- 2048 S Bon View Ave Unit F
- 2048 S Bon View Ave Unit E
- 2048 S Bon View Ave Unit D
- 2048 S Bon View Ave Unit C
- 2048 S Bon View Ave Unit B