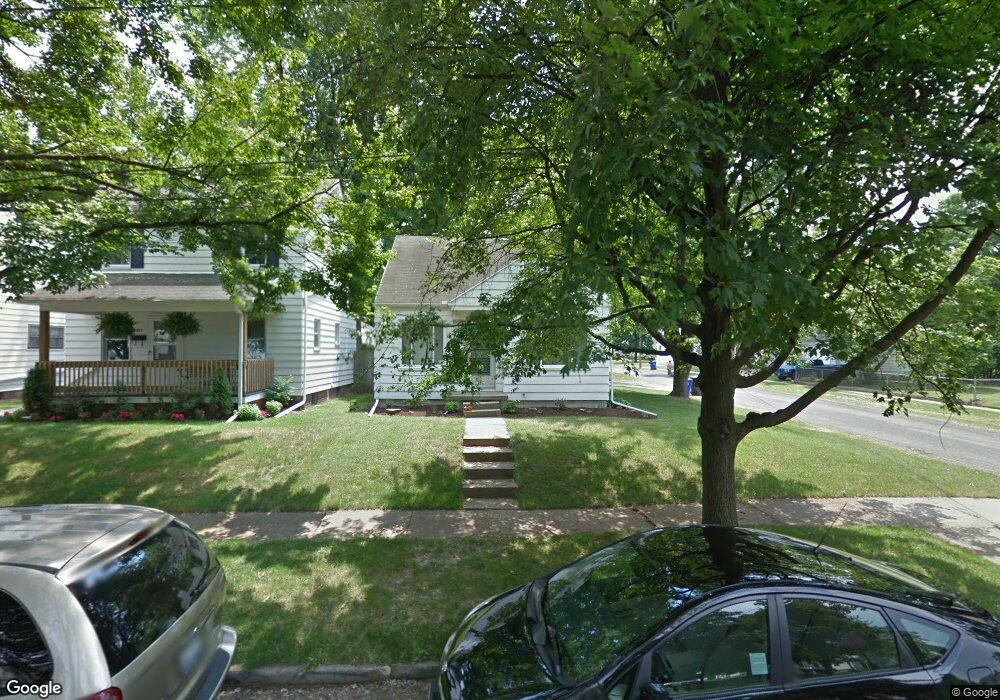
2059 Talbot St Toledo, OH 43613
DeVeaux NeighborhoodEstimated Value: $81,616 - $105,000
2
Beds
1
Bath
858
Sq Ft
$106/Sq Ft
Est. Value
About This Home
This home is located at 2059 Talbot St, Toledo, OH 43613 and is currently estimated at $90,654, approximately $105 per square foot. 2059 Talbot St is a home located in Lucas County with nearby schools including DeVeaux Elementary School, Start High School, and Horizon Science Academy - Toledo High School.
Ownership History
Date
Name
Owned For
Owner Type
Purchase Details
Closed on
Feb 27, 2019
Sold by
Dolan Janel M
Bought by
Dolan James A
Current Estimated Value
Purchase Details
Closed on
Jul 27, 2000
Sold by
Alma Richburg
Bought by
Dolan James A and Dolan Janel M
Home Financials for this Owner
Home Financials are based on the most recent Mortgage that was taken out on this home.
Original Mortgage
$43,000
Outstanding Balance
$15,558
Interest Rate
8.19%
Estimated Equity
$75,096
Purchase Details
Closed on
Feb 18, 2000
Sold by
Richburg Living Tr Richburg Alma, Trustee Of
Bought by
Richburg Alma
Home Financials for this Owner
Home Financials are based on the most recent Mortgage that was taken out on this home.
Original Mortgage
$40,000
Interest Rate
8.21%
Purchase Details
Closed on
Jul 23, 1996
Sold by
Mattox Archie V
Bought by
Richburg Alma L
Home Financials for this Owner
Home Financials are based on the most recent Mortgage that was taken out on this home.
Original Mortgage
$31,600
Interest Rate
8.75%
Mortgage Type
New Conventional
Create a Home Valuation Report for This Property
The Home Valuation Report is an in-depth analysis detailing your home's value as well as a comparison with similar homes in the area
Home Values in the Area
Average Home Value in this Area
Purchase History
| Date | Buyer | Sale Price | Title Company |
|---|---|---|---|
| Dolan James A | -- | None Available | |
| Dolan James A | $55,000 | A.R.E.A. Title Agency Inc | |
| Richburg Alma | -- | A.R.E.A. Title Agency Inc | |
| Richburg Alma L | $39,600 | -- |
Source: Public Records
Mortgage History
| Date | Status | Borrower | Loan Amount |
|---|---|---|---|
| Open | Dolan James A | $43,000 | |
| Closed | Richburg Alma | $40,000 | |
| Closed | Richburg Alma L | $31,600 |
Source: Public Records
Tax History Compared to Growth
Tax History
| Year | Tax Paid | Tax Assessment Tax Assessment Total Assessment is a certain percentage of the fair market value that is determined by local assessors to be the total taxable value of land and additions on the property. | Land | Improvement |
|---|---|---|---|---|
| 2024 | $635 | $18,725 | $6,755 | $11,970 |
| 2023 | $1,286 | $18,340 | $3,675 | $14,665 |
| 2022 | $1,292 | $18,340 | $3,675 | $14,665 |
| 2021 | $1,316 | $18,340 | $3,675 | $14,665 |
| 2020 | $1,443 | $17,780 | $3,535 | $14,245 |
| 2019 | $1,395 | $17,780 | $3,535 | $14,245 |
| 2018 | $1,423 | $17,780 | $3,535 | $14,245 |
| 2017 | $1,431 | $17,395 | $3,465 | $13,930 |
| 2016 | $1,447 | $49,700 | $9,900 | $39,800 |
| 2015 | $1,438 | $49,700 | $9,900 | $39,800 |
| 2014 | $1,095 | $17,400 | $3,470 | $13,930 |
| 2013 | $1,095 | $17,400 | $3,470 | $13,930 |
Source: Public Records
Map
Nearby Homes
- 3715 Shelbourne Ave
- 2050 Berdan Ave
- 2012 Berdan Ave
- 2035 Barrows St
- 3718 Sherbrooke Rd
- 1939 Balkan Place
- 1935 Talbot St
- 2026 Berkshire Place
- 2146 Marlow Rd
- 2220 Beaufort Ave
- 2056 Fairfax Rd
- 2040 Fairfax Rd
- 2106 Fairfax Rd
- 3656 Bellevue Rd
- 1959 Brussels St
- 2045 Fairfax Rd
- 1952 Fairfax Rd
- 1846 Balkan Place
- 1929 Marlow Rd
- 1840 Talbot St
- 2057 Talbot St
- 2053 Talbot St
- 2049 Talbot St
- 3649 Westland Ave
- 2058 Loxley Rd
- 2043 Talbot St
- 2105 Talbot St
- 2050 Loxley Rd
- 2102 Loxley Rd
- 2058 Talbot St
- 2056 Talbot St
- 2041 Talbot St
- 2046 Loxley Rd
- 2106 Loxley Rd
- 2052 Talbot St
- 2109 Talbot St
- 2039 Talbot St
- 2048 Talbot St
- 2042 Loxley Rd
- 3703 Westland Ave