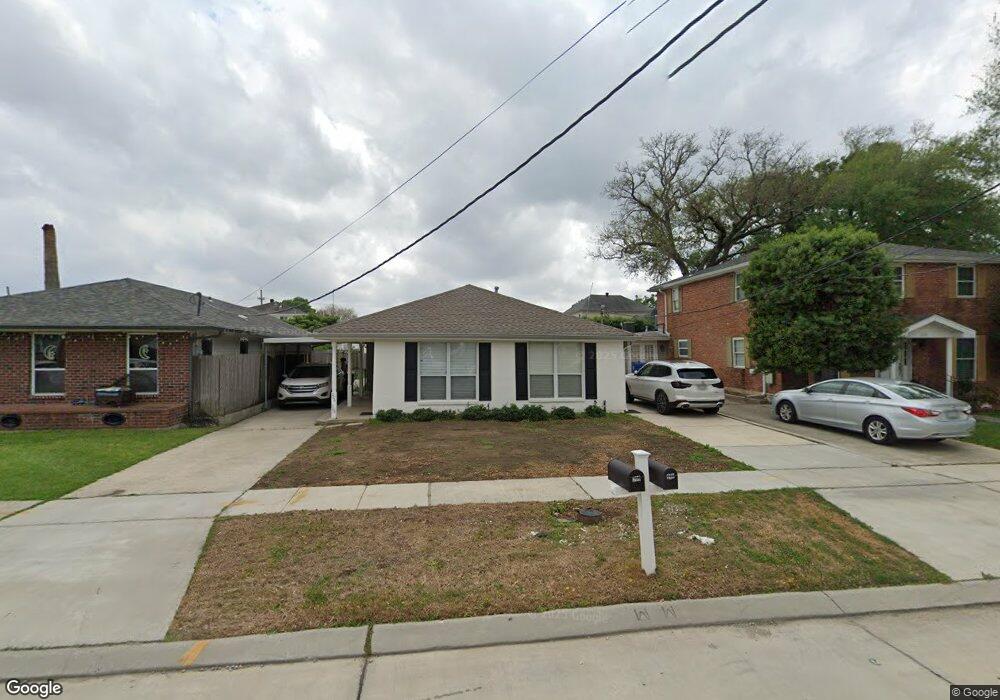
206 22nd St New Orleans, LA 70124
West End NeighborhoodEstimated Value: $418,000 - $482,000
5
Beds
3
Baths
2,295
Sq Ft
$197/Sq Ft
Est. Value
About This Home
This home is located at 206 22nd St, New Orleans, LA 70124 and is currently estimated at $451,498, approximately $196 per square foot. 206 22nd St is a home located in Orleans Parish with nearby schools including Mary Bethune Elementary School, Edward Hynes Charter School - Lakeview, and Edward Hynes Charter School.
Ownership History
Date
Name
Owned For
Owner Type
Purchase Details
Closed on
Dec 17, 2008
Sold by
Plaia John A
Bought by
Plaia Jamie L and Palaia,Lindsey K
Current Estimated Value
Home Financials for this Owner
Home Financials are based on the most recent Mortgage that was taken out on this home.
Original Mortgage
$75,000
Outstanding Balance
$49,701
Interest Rate
6.19%
Estimated Equity
$401,797
Purchase Details
Closed on
Jan 2, 2007
Sold by
Hunt Lawrence D
Bought by
Plaia John A
Create a Home Valuation Report for This Property
The Home Valuation Report is an in-depth analysis detailing your home's value as well as a comparison with similar homes in the area
Home Values in the Area
Average Home Value in this Area
Purchase History
| Date | Buyer | Sale Price | Title Company |
|---|---|---|---|
| Plaia Jamie L | $140,000 | -- | |
| Plaia John A | $70,000 | -- |
Source: Public Records
Mortgage History
| Date | Status | Borrower | Loan Amount |
|---|---|---|---|
| Open | Plaia Jamie L | $75,000 |
Source: Public Records
Tax History Compared to Growth
Tax History
| Year | Tax Paid | Tax Assessment Tax Assessment Total Assessment is a certain percentage of the fair market value that is determined by local assessors to be the total taxable value of land and additions on the property. | Land | Improvement |
|---|---|---|---|---|
| 2025 | $3,849 | $34,870 | $12,000 | $22,870 |
| 2024 | $4,672 | $34,870 | $12,000 | $22,870 |
| 2023 | $3,526 | $35,270 | $12,000 | $23,270 |
| 2022 | $3,526 | $30,800 | $12,000 | $18,800 |
| 2021 | $4,245 | $35,270 | $12,000 | $23,270 |
| 2020 | $4,285 | $35,270 | $12,000 | $23,270 |
| 2019 | $2,850 | $24,830 | $9,600 | $15,230 |
| 2018 | $2,902 | $24,830 | $9,600 | $15,230 |
| 2017 | $2,763 | $24,830 | $9,600 | $15,230 |
| 2016 | $2,834 | $24,830 | $9,600 | $15,230 |
| 2015 | $2,747 | $24,610 | $4,500 | $20,110 |
| 2014 | -- | $24,610 | $4,500 | $20,110 |
| 2013 | -- | $24,610 | $4,500 | $20,110 |
Source: Public Records
Map
Nearby Homes