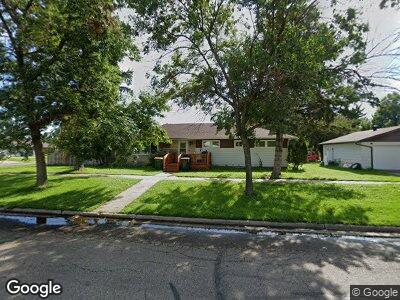
206 3rd St SE Hillsboro, ND 58045
Estimated Value: $193,000 - $304,000
3
Beds
3
Baths
1,532
Sq Ft
$167/Sq Ft
Est. Value
About This Home
This home is located at 206 3rd St SE, Hillsboro, ND 58045 and is currently estimated at $255,571, approximately $166 per square foot. 206 3rd St SE is a home located in Traill County with nearby schools including Hillsboro Elementary School, Spruce Lane Colony School, and Hillsboro High School.
Ownership History
Date
Name
Owned For
Owner Type
Purchase Details
Closed on
Jul 2, 2015
Sold by
Dale Mark Aaron and Raucy Dale Judy Lee
Bought by
Enger Kelly
Current Estimated Value
Home Financials for this Owner
Home Financials are based on the most recent Mortgage that was taken out on this home.
Original Mortgage
$146,291
Interest Rate
4.25%
Mortgage Type
FHA
Purchase Details
Closed on
Nov 30, 2012
Sold by
Wildeman Lois C
Bought by
Dale Mark Aaron and Dale Jo Judy
Create a Home Valuation Report for This Property
The Home Valuation Report is an in-depth analysis detailing your home's value as well as a comparison with similar homes in the area
Home Values in the Area
Average Home Value in this Area
Purchase History
| Date | Buyer | Sale Price | Title Company |
|---|---|---|---|
| Enger Kelly | -- | Regency Title | |
| Dale Mark Aaron | $110,000 | None Available |
Source: Public Records
Mortgage History
| Date | Status | Borrower | Loan Amount |
|---|---|---|---|
| Open | Enger Kelly | $5,619 | |
| Open | Enger Kelly | $169,312 | |
| Open | Enger Kelsey | $264,000 | |
| Closed | Enger Kelly | $136,600 | |
| Closed | Enger Kelly | $146,291 |
Source: Public Records
Tax History Compared to Growth
Tax History
| Year | Tax Paid | Tax Assessment Tax Assessment Total Assessment is a certain percentage of the fair market value that is determined by local assessors to be the total taxable value of land and additions on the property. | Land | Improvement |
|---|---|---|---|---|
| 2024 | $2,575 | $95,100 | $5,250 | $89,850 |
| 2023 | $2,590 | $95,100 | $5,250 | $89,850 |
| 2022 | $2,360 | $87,051 | $3,415 | $83,636 |
| 2021 | $2,785 | $84,515 | $3,415 | $81,100 |
| 2020 | $2,662 | $80,415 | $3,415 | $77,000 |
| 2019 | $2,644 | $79,000 | $3,750 | $75,250 |
| 2018 | $1,958 | $75,809 | $3,676 | $72,133 |
| 2017 | $2,610 | $73,304 | $0 | $0 |
| 2016 | $1,321 | $0 | $0 | $0 |
| 2015 | $1,321 | $0 | $0 | $0 |
| 2014 | $1,321 | $0 | $0 | $0 |
| 2013 | -- | $0 | $0 | $0 |
Source: Public Records
Map
Nearby Homes