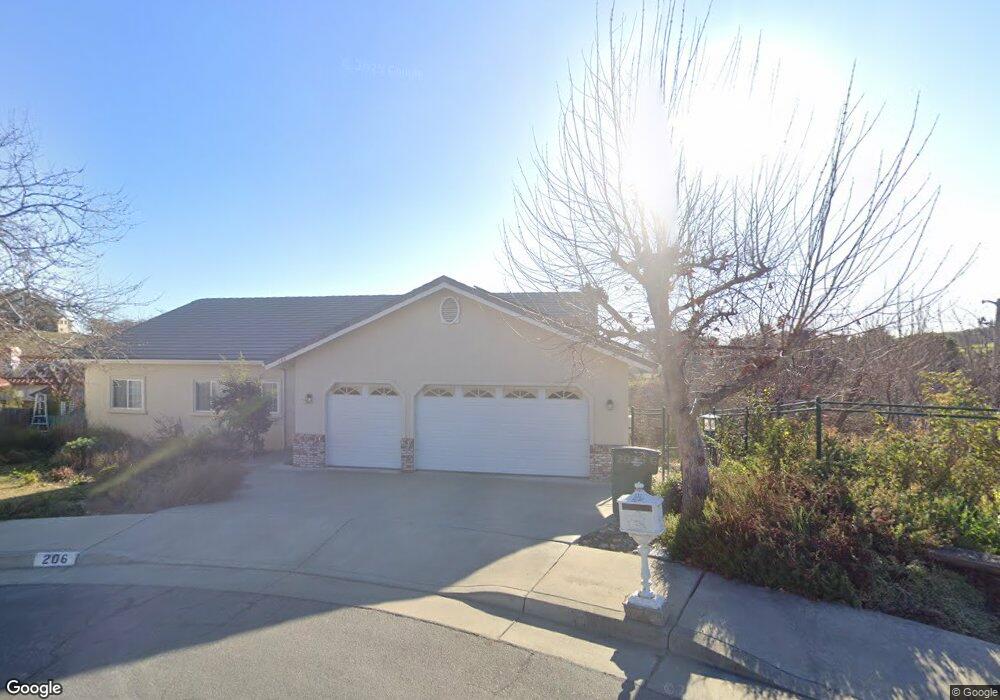
206 Blossom Ct Paso Robles, CA 93446
Estimated Value: $870,000 - $1,308,000
4
Beds
3
Baths
2,500
Sq Ft
$435/Sq Ft
Est. Value
About This Home
This home is located at 206 Blossom Ct, Paso Robles, CA 93446 and is currently estimated at $1,088,489, approximately $435 per square foot. 206 Blossom Ct is a home located in San Luis Obispo County with nearby schools including Glen Speck Elementary School, George H. Flamson Middle School, and Paso Robles High School.
Ownership History
Date
Name
Owned For
Owner Type
Purchase Details
Closed on
May 4, 2018
Sold by
Wick Aurelia
Bought by
Wick Aurelia and Aurelia Wick Revocable Living
Current Estimated Value
Purchase Details
Closed on
Jan 12, 2011
Sold by
Amy John W
Bought by
Wick Aurelia
Home Financials for this Owner
Home Financials are based on the most recent Mortgage that was taken out on this home.
Original Mortgage
$281,250
Outstanding Balance
$184,453
Interest Rate
4%
Mortgage Type
New Conventional
Estimated Equity
$904,036
Purchase Details
Closed on
Jan 11, 2011
Sold by
Kemp Gary E and Kemp Deione L
Bought by
Wick Aurelia
Home Financials for this Owner
Home Financials are based on the most recent Mortgage that was taken out on this home.
Original Mortgage
$281,250
Outstanding Balance
$184,453
Interest Rate
4%
Mortgage Type
New Conventional
Estimated Equity
$904,036
Purchase Details
Closed on
Jul 20, 2006
Sold by
Allan Dennis Theodore and Allan Margaret Mary
Bought by
Kemp Gary E and Kemp Deione L
Home Financials for this Owner
Home Financials are based on the most recent Mortgage that was taken out on this home.
Original Mortgage
$406,250
Interest Rate
6.69%
Mortgage Type
Purchase Money Mortgage
Purchase Details
Closed on
Jun 27, 2005
Sold by
Allan Dennis T and Allan Margaret
Bought by
Allan Dennis Theodore and Allan Margaret Mary
Purchase Details
Closed on
Mar 21, 2005
Sold by
Jekel Richard
Bought by
Allan Dennis T and Allan Margaret
Home Financials for this Owner
Home Financials are based on the most recent Mortgage that was taken out on this home.
Original Mortgage
$460,000
Interest Rate
6.37%
Mortgage Type
Fannie Mae Freddie Mac
Purchase Details
Closed on
Aug 14, 2000
Sold by
Conner Dan D and Conner Roberta
Bought by
Jekel Richard
Purchase Details
Closed on
Jul 29, 1999
Sold by
Easterbrook Andrew C and Easterbrook Sheryl
Bought by
Conner Dan D and Conner Roberta
Purchase Details
Closed on
Feb 25, 1997
Sold by
Carnes Gary and Carnes Karen
Bought by
Easterbrook Andrew C and Easterbrook Sheryl
Home Financials for this Owner
Home Financials are based on the most recent Mortgage that was taken out on this home.
Original Mortgage
$47,000
Interest Rate
7.86%
Purchase Details
Closed on
Jan 3, 1996
Sold by
Hull Carolyn S
Bought by
Carnes Gary and Carnes Karen
Home Financials for this Owner
Home Financials are based on the most recent Mortgage that was taken out on this home.
Original Mortgage
$28,875
Interest Rate
7.18%
Create a Home Valuation Report for This Property
The Home Valuation Report is an in-depth analysis detailing your home's value as well as a comparison with similar homes in the area
Home Values in the Area
Average Home Value in this Area
Purchase History
| Date | Buyer | Sale Price | Title Company |
|---|---|---|---|
| Wick Aurelia | -- | None Available | |
| Wick Aurelia | -- | First American Title Company | |
| Wick Aurelia | $375,000 | First American Title Company | |
| Kemp Gary E | $625,000 | Fidelity National Title Co | |
| Allan Dennis Theodore | -- | -- | |
| Allan Dennis T | $625,000 | Fidelity Title Company | |
| Jekel Richard | $280,000 | First American Title | |
| Conner Dan D | $60,000 | First American Title | |
| Easterbrook Andrew C | $47,000 | Fidelity National Title Co | |
| Carnes Gary | $39,000 | Chicago Title Co |
Source: Public Records
Mortgage History
| Date | Status | Borrower | Loan Amount |
|---|---|---|---|
| Open | Wick Aurelia | $281,250 | |
| Previous Owner | Kemp Gary E | $406,250 | |
| Previous Owner | Allan Dennis T | $460,000 | |
| Previous Owner | Easterbrook Andrew C | $47,000 | |
| Previous Owner | Carnes Gary | $28,875 |
Source: Public Records
Tax History Compared to Growth
Tax History
| Year | Tax Paid | Tax Assessment Tax Assessment Total Assessment is a certain percentage of the fair market value that is determined by local assessors to be the total taxable value of land and additions on the property. | Land | Improvement |
|---|---|---|---|---|
| 2025 | $5,159 | $480,426 | $128,110 | $352,316 |
| 2024 | $5,073 | $471,007 | $125,599 | $345,408 |
| 2023 | $5,073 | $461,773 | $123,137 | $338,636 |
| 2022 | $4,996 | $452,720 | $120,723 | $331,997 |
| 2021 | $4,909 | $443,844 | $118,356 | $325,488 |
| 2020 | $4,842 | $439,294 | $117,143 | $322,151 |
| 2019 | $4,771 | $430,682 | $114,847 | $315,835 |
| 2018 | $4,705 | $422,239 | $112,596 | $309,643 |
| 2017 | $4,423 | $413,961 | $110,389 | $303,572 |
| 2016 | $4,334 | $405,845 | $108,225 | $297,620 |
| 2015 | $4,317 | $399,750 | $106,600 | $293,150 |
| 2014 | $4,166 | $391,920 | $104,512 | $287,408 |
Source: Public Records
Map
Nearby Homes
- 204 Blossom Ct
- 401 Peachtree Ln
- 207 Blossom Ct
- 403 Peachtree Ln
- 208 4th St
- 205 Blossom Ct
- 204 4th St
- 204 4th St Unit WE
- 203 Blossom Ct
- 202 Blossom Ct
- 201 Blossom Ct
- 202 4th St
- 202 4th St Unit WE
- 411 Peachtree Ln
- 409 Peachtree Ln
- 407 Peachtree Ln
- 402 Peachtree Ln
- 413 Peachtree Ln
- 404 Peachtree Ln
- 199 Blossom Ct