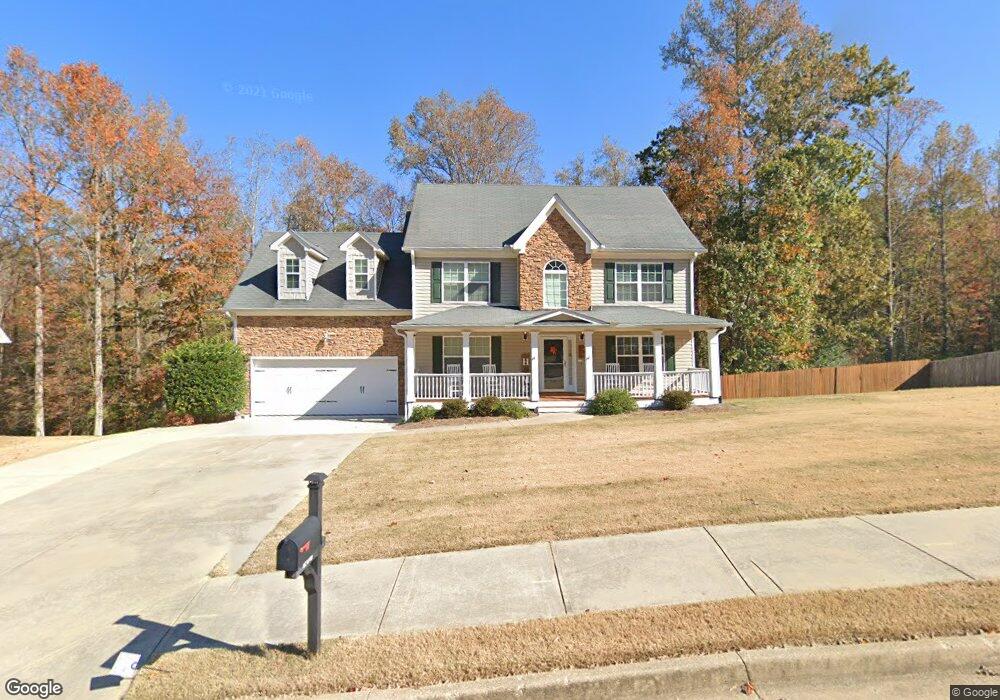
206 Chandler Ridge Dr Unit 15 Douglasville, GA 30134
Estimated Value: $374,564 - $425,000
5
Beds
4
Baths
3,209
Sq Ft
$125/Sq Ft
Est. Value
About This Home
This home is located at 206 Chandler Ridge Dr Unit 15, Douglasville, GA 30134 and is currently estimated at $399,641, approximately $124 per square foot. 206 Chandler Ridge Dr Unit 15 is a home located in Paulding County with nearby schools including Connie Dugan Elementary School, Irma C. Austin Middle School, and South Paulding High School.
Ownership History
Date
Name
Owned For
Owner Type
Purchase Details
Closed on
Jul 3, 2017
Sold by
Whitmire Nathan D
Bought by
Hartig Gregory and Hartig Katie
Current Estimated Value
Home Financials for this Owner
Home Financials are based on the most recent Mortgage that was taken out on this home.
Original Mortgage
$230,000
Outstanding Balance
$191,353
Interest Rate
3.94%
Mortgage Type
VA
Estimated Equity
$208,288
Purchase Details
Closed on
Jun 26, 2009
Sold by
Whitmire Nathan D
Bought by
Whitmire Nathan D and Whitmire Kelly M
Purchase Details
Closed on
Mar 16, 2006
Sold by
Chandler Ridge Properties Inc
Bought by
Whitmire Nathan D
Home Financials for this Owner
Home Financials are based on the most recent Mortgage that was taken out on this home.
Original Mortgage
$188,049
Interest Rate
6.19%
Mortgage Type
FHA
Create a Home Valuation Report for This Property
The Home Valuation Report is an in-depth analysis detailing your home's value as well as a comparison with similar homes in the area
Home Values in the Area
Average Home Value in this Area
Purchase History
| Date | Buyer | Sale Price | Title Company |
|---|---|---|---|
| Hartig Gregory | $230,000 | -- | |
| Whitmire Nathan D | -- | -- | |
| Whitmire Nathan D | $191,000 | -- |
Source: Public Records
Mortgage History
| Date | Status | Borrower | Loan Amount |
|---|---|---|---|
| Open | Hartig Gregory | $230,000 | |
| Previous Owner | Whitmire Nathan D | $188,049 |
Source: Public Records
Tax History Compared to Growth
Tax History
| Year | Tax Paid | Tax Assessment Tax Assessment Total Assessment is a certain percentage of the fair market value that is determined by local assessors to be the total taxable value of land and additions on the property. | Land | Improvement |
|---|---|---|---|---|
| 2024 | $715 | $147,080 | $12,000 | $135,080 |
| 2023 | $3,771 | $147,188 | $12,000 | $135,188 |
| 2022 | $3,034 | $118,264 | $12,000 | $106,264 |
| 2021 | $2,847 | $99,840 | $12,000 | $87,840 |
| 2020 | $2,768 | $95,040 | $12,000 | $83,040 |
| 2019 | $2,627 | $89,040 | $12,000 | $77,040 |
| 2018 | $2,712 | $91,880 | $12,000 | $79,880 |
| 2017 | $2,112 | $71,000 | $12,000 | $59,000 |
| 2016 | $2,055 | $69,840 | $12,000 | $57,840 |
| 2015 | $1,701 | $57,120 | $12,000 | $45,120 |
| 2014 | $1,354 | $44,744 | $12,000 | $32,744 |
| 2013 | -- | $38,640 | $12,000 | $26,640 |
Source: Public Records
Map
Nearby Homes
- 3061 Dallas Nebo Rd
- 269 Shelby Ln
- 461 Austin Bridge Rd
- 280 Glenn Eagles Way
- 59 Creekside Bluff
- 19 Creekside View
- 554 Oak Landing Cir
- 56 Creekside Point
- 6 Creekside Bluff
- 23 Bomar Ln
- 196 Lambeth Dr
- 43 Oak Landing Cir
- 81 Bridgemill Dr
- 496 Hughes Rd
- 66 Charlotte Place
- Wyatt Plan at Savannah Lakes - Lochmoor at Savannah Lakes
- Blair Plan at Savannah Lakes - Lochmoor at Savannah Lakes
- Camden Plan at Savannah Lakes - Designer Collection
- Emmett Plan at Savannah Lakes - Lochmoor at Savannah Lakes
- Charles Plan at Savannah Lakes - Lochmoor at Savannah Lakes
- 206 Chandler Ridge Dr
- 184 Chandler Ridge Dr
- 224 Chandler Ridge Dr
- 201 Chandler Ridge Dr
- 154 Chandler Ridge Dr
- 225 Chandler Ridge Dr
- 246 Chandler Ridge Dr
- 177 Chandler Ridge Dr
- 5133 Ridge Rd
- 251 Chandler Ridge Dr Unit 251
- 251 Chandler Ridge Dr
- 251 Chandler Ridge Dr Unit .
- 155 Chandler Ridge Dr
- 137 Chandler Ridge Dr
- 120 Chandler Ridge Dr
- 263 Chandler Ridge Dr
- 271 Chandler Ridge Dr
- 103 Chandler Ridge Dr
- 5005 Ridge Rd
- 84 Chandler Ridge Dr