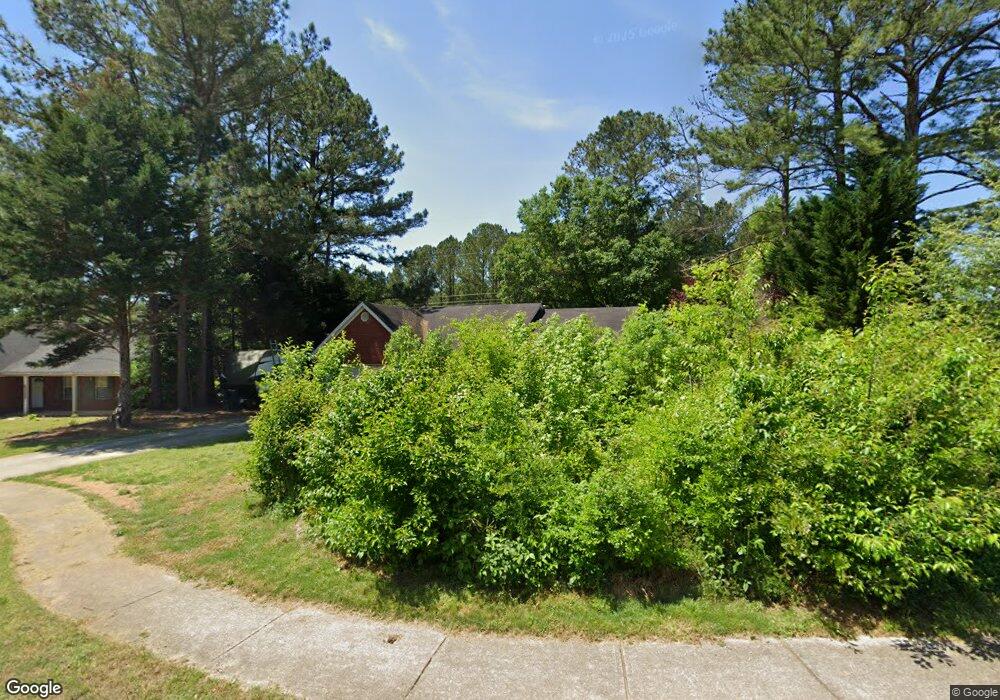
206 Drake Elm Ct Hampton, GA 30228
Estimated Value: $205,000 - $255,000
3
Beds
2
Baths
1,318
Sq Ft
$178/Sq Ft
Est. Value
About This Home
This home is located at 206 Drake Elm Ct, Hampton, GA 30228 and is currently estimated at $234,852, approximately $178 per square foot. 206 Drake Elm Ct is a home located in Henry County with nearby schools including Rocky Creek Elementary School, Hampton Middle School, and Hampton High School.
Ownership History
Date
Name
Owned For
Owner Type
Purchase Details
Closed on
Jun 30, 2006
Sold by
Dietsch Jeremy E
Bought by
Anderson David and Anderson Lawanda
Current Estimated Value
Home Financials for this Owner
Home Financials are based on the most recent Mortgage that was taken out on this home.
Original Mortgage
$132,949
Outstanding Balance
$78,643
Interest Rate
6.68%
Mortgage Type
FHA
Estimated Equity
$156,209
Purchase Details
Closed on
Mar 29, 2002
Sold by
Hobgood Michael B and Hobgood Jewel L
Bought by
Dietsch Jeremy E
Home Financials for this Owner
Home Financials are based on the most recent Mortgage that was taken out on this home.
Original Mortgage
$112,050
Interest Rate
7.18%
Mortgage Type
VA
Purchase Details
Closed on
May 5, 1999
Sold by
Den-Ric Corp
Bought by
Hobgood Michael B and Hobgood Jewel
Home Financials for this Owner
Home Financials are based on the most recent Mortgage that was taken out on this home.
Original Mortgage
$91,818
Interest Rate
6.87%
Mortgage Type
New Conventional
Create a Home Valuation Report for This Property
The Home Valuation Report is an in-depth analysis detailing your home's value as well as a comparison with similar homes in the area
Home Values in the Area
Average Home Value in this Area
Purchase History
| Date | Buyer | Sale Price | Title Company |
|---|---|---|---|
| Anderson David | $134,000 | -- | |
| Dietsch Jeremy E | $109,900 | -- | |
| Hobgood Michael B | $91,900 | -- |
Source: Public Records
Mortgage History
| Date | Status | Borrower | Loan Amount |
|---|---|---|---|
| Open | Anderson David | $132,949 | |
| Previous Owner | Dietsch Jeremy E | $112,050 | |
| Previous Owner | Hobgood Michael B | $91,818 |
Source: Public Records
Tax History Compared to Growth
Tax History
| Year | Tax Paid | Tax Assessment Tax Assessment Total Assessment is a certain percentage of the fair market value that is determined by local assessors to be the total taxable value of land and additions on the property. | Land | Improvement |
|---|---|---|---|---|
| 2025 | $3,916 | $98,520 | $12,000 | $86,520 |
| 2024 | $3,916 | $93,360 | $12,000 | $81,360 |
| 2023 | $3,619 | $90,160 | $10,000 | $80,160 |
| 2022 | $3,020 | $73,760 | $10,000 | $63,760 |
| 2021 | $2,289 | $62,640 | $10,000 | $52,640 |
| 2020 | $2,050 | $56,040 | $10,000 | $46,040 |
| 2019 | $1,815 | $48,840 | $8,000 | $40,840 |
| 2018 | $1,695 | $45,920 | $8,000 | $37,920 |
| 2016 | $1,520 | $41,200 | $6,000 | $35,200 |
| 2015 | $1,432 | $37,480 | $6,000 | $31,480 |
| 2014 | $1,205 | $31,240 | $4,000 | $27,240 |
Source: Public Records
Map
Nearby Homes
- 120 Bridgemill Dr
- 53 Elm St
- 248 Fern Ct
- 325 Peachtree Cir
- 2040 Elm Grove Ln
- 31 Elm St
- 21 Elm St
- 1904 Elm Park Dr
- 220 Windpher Ridge
- 2012 Elm Grove Ln
- 162 Old Hampton Way
- 19 Mcdonough St
- 32 Mcdonough St
- Ashley 24 Plan at Glenmaye
- Dennis Plan at Glenmaye
- Ashley Plan at Glenmaye
- Hayden Plan at Glenmaye
- Somerset Plan at Glenmaye
- Ashley 22 Plan at Glenmaye
- Celia Plan at Glenmaye
- 204 Drake Elm Ct
- 208 Drake Elm Ct Unit 2
- 202 Drake Elm Ct
- 106 Elmwood Dr Unit 54
- 106 Elmwood Dr
- 210 Drake Elm Ct
- 0 Elmwood Dr Unit 7451525
- 0 Elmwood Dr Unit 8899630
- 207 Drake Elm Ct
- 205 Drake Elm Ct
- 205 Elm Ddrake Ct
- 203 Drake Elm Ct
- 104 Elmwood Dr
- 201 Drake Elm Ct
- 107 Elmwood Dr
- 105 Elmwood Dr
- 109 Elmwood Dr
- 84 Elm St
- 90 Elm St
- 306 Lacebark Ln