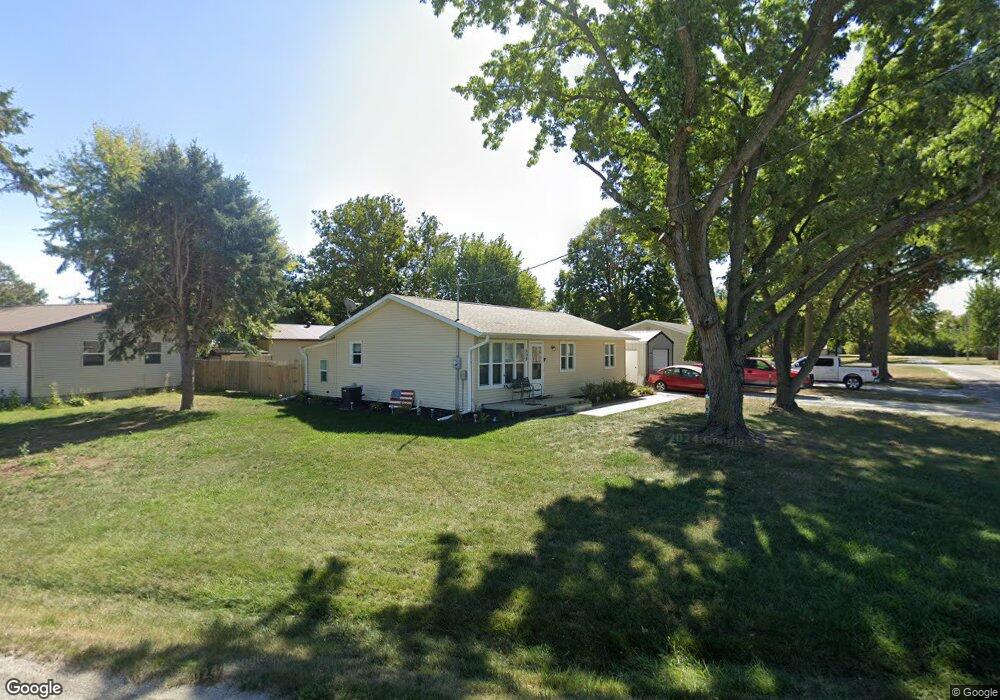
206 Dupont St Farragut, IA 51639
Estimated Value: $107,000 - $157,300
2
Beds
2
Baths
1,758
Sq Ft
$72/Sq Ft
Est. Value
About This Home
This home is located at 206 Dupont St, Farragut, IA 51639 and is currently estimated at $126,325, approximately $71 per square foot. 206 Dupont St is a home located in Fremont County with nearby schools including Shenandoah Elementary School, Shenandoah Middle School, and Shenandoah High School.
Ownership History
Date
Name
Owned For
Owner Type
Purchase Details
Closed on
Apr 18, 2019
Sold by
Inman Joshua and Inman April
Bought by
Cary Byron W and Cary Debra D
Current Estimated Value
Home Financials for this Owner
Home Financials are based on the most recent Mortgage that was taken out on this home.
Original Mortgage
$75,000
Outstanding Balance
$65,804
Interest Rate
4.2%
Mortgage Type
VA
Estimated Equity
$60,521
Create a Home Valuation Report for This Property
The Home Valuation Report is an in-depth analysis detailing your home's value as well as a comparison with similar homes in the area
Home Values in the Area
Average Home Value in this Area
Purchase History
| Date | Buyer | Sale Price | Title Company |
|---|---|---|---|
| Cary Byron W | -- | -- |
Source: Public Records
Mortgage History
| Date | Status | Borrower | Loan Amount |
|---|---|---|---|
| Open | Cary Byron W | $75,000 |
Source: Public Records
Tax History Compared to Growth
Tax History
| Year | Tax Paid | Tax Assessment Tax Assessment Total Assessment is a certain percentage of the fair market value that is determined by local assessors to be the total taxable value of land and additions on the property. | Land | Improvement |
|---|---|---|---|---|
| 2025 | $1,628 | $127,240 | $4,940 | $122,300 |
| 2024 | $1,628 | $128,900 | $4,940 | $123,960 |
| 2023 | $1,966 | $128,900 | $4,940 | $123,960 |
| 2022 | $1,696 | $103,750 | $7,840 | $95,910 |
| 2021 | $1,696 | $96,790 | $7,320 | $89,470 |
| 2020 | $1,366 | $72,660 | $7,320 | $65,340 |
| 2019 | $1,686 | $72,970 | $0 | $0 |
| 2018 | $1,660 | $72,970 | $0 | $0 |
| 2017 | $1,660 | $65,730 | $0 | $0 |
| 2016 | $1,496 | $65,730 | $0 | $0 |
| 2015 | $1,496 | $65,730 | $0 | $0 |
| 2014 | $1,514 | $65,730 | $0 | $0 |
Source: Public Records
Map
Nearby Homes