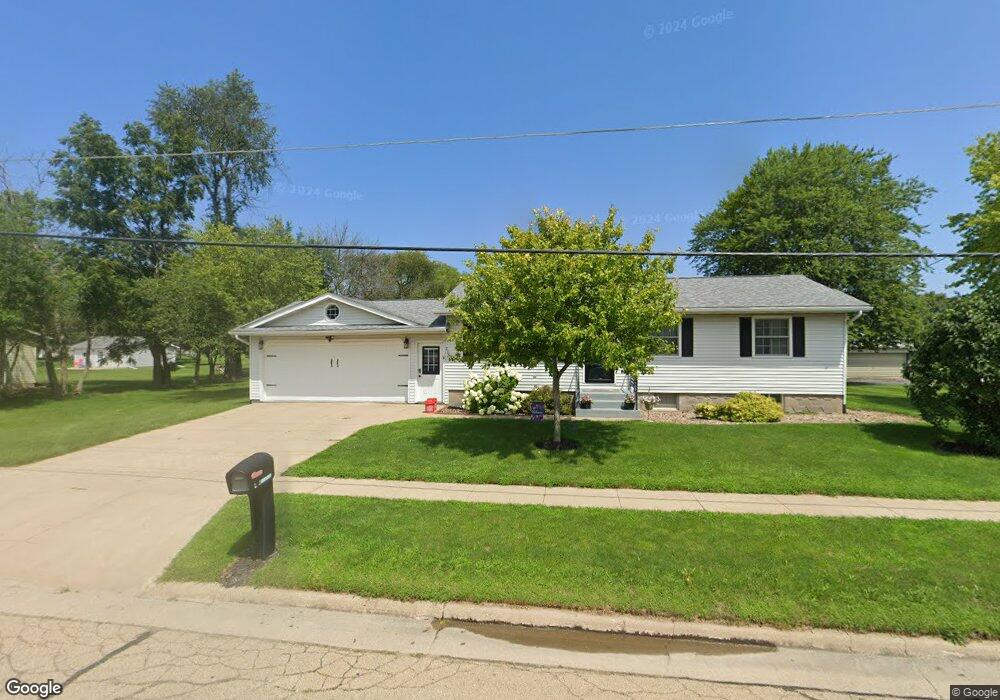
206 E 2nd St de Witt, IA 52742
Estimated Value: $203,000 - $223,000
3
Beds
1
Bath
960
Sq Ft
$224/Sq Ft
Est. Value
About This Home
This home is located at 206 E 2nd St, de Witt, IA 52742 and is currently estimated at $214,831, approximately $223 per square foot. 206 E 2nd St is a home located in Clinton County with nearby schools including Ekstrand Elementary School, Central Dewitt Intermediate School, and Central Dewitt Middle School.
Ownership History
Date
Name
Owned For
Owner Type
Purchase Details
Closed on
Feb 28, 2022
Sold by
Selleck Janet H
Bought by
Scott Darcie M
Current Estimated Value
Home Financials for this Owner
Home Financials are based on the most recent Mortgage that was taken out on this home.
Original Mortgage
$180,000
Outstanding Balance
$167,425
Interest Rate
3.69%
Mortgage Type
New Conventional
Estimated Equity
$47,406
Purchase Details
Closed on
Jun 11, 2010
Sold by
Selleck James K and Selleck Janet H
Bought by
Selleck Janet H
Create a Home Valuation Report for This Property
The Home Valuation Report is an in-depth analysis detailing your home's value as well as a comparison with similar homes in the area
Home Values in the Area
Average Home Value in this Area
Purchase History
| Date | Buyer | Sale Price | Title Company |
|---|---|---|---|
| Scott Darcie M | $200,000 | None Listed On Document | |
| Selleck Janet H | -- | None Available |
Source: Public Records
Mortgage History
| Date | Status | Borrower | Loan Amount |
|---|---|---|---|
| Open | Scott Darcie M | $180,000 |
Source: Public Records
Tax History Compared to Growth
Tax History
| Year | Tax Paid | Tax Assessment Tax Assessment Total Assessment is a certain percentage of the fair market value that is determined by local assessors to be the total taxable value of land and additions on the property. | Land | Improvement |
|---|---|---|---|---|
| 2025 | $3,746 | $217,670 | $32,500 | $185,170 |
| 2024 | $3,746 | $203,680 | $32,500 | $171,180 |
| 2023 | $3,440 | $203,680 | $32,500 | $171,180 |
| 2022 | $3,174 | $183,680 | $32,500 | $151,180 |
| 2021 | $3,098 | $168,650 | $36,000 | $132,650 |
| 2020 | $3,098 | $157,120 | $36,000 | $121,120 |
| 2019 | $2,976 | $151,350 | $0 | $0 |
| 2018 | $2,898 | $151,350 | $0 | $0 |
| 2017 | $2,664 | $151,350 | $0 | $0 |
| 2016 | $2,548 | $134,400 | $0 | $0 |
| 2015 | $2,548 | $134,400 | $0 | $0 |
| 2014 | $2,582 | $134,400 | $0 | $0 |
| 2013 | $2,536 | $0 | $0 | $0 |
Source: Public Records
Map
Nearby Homes