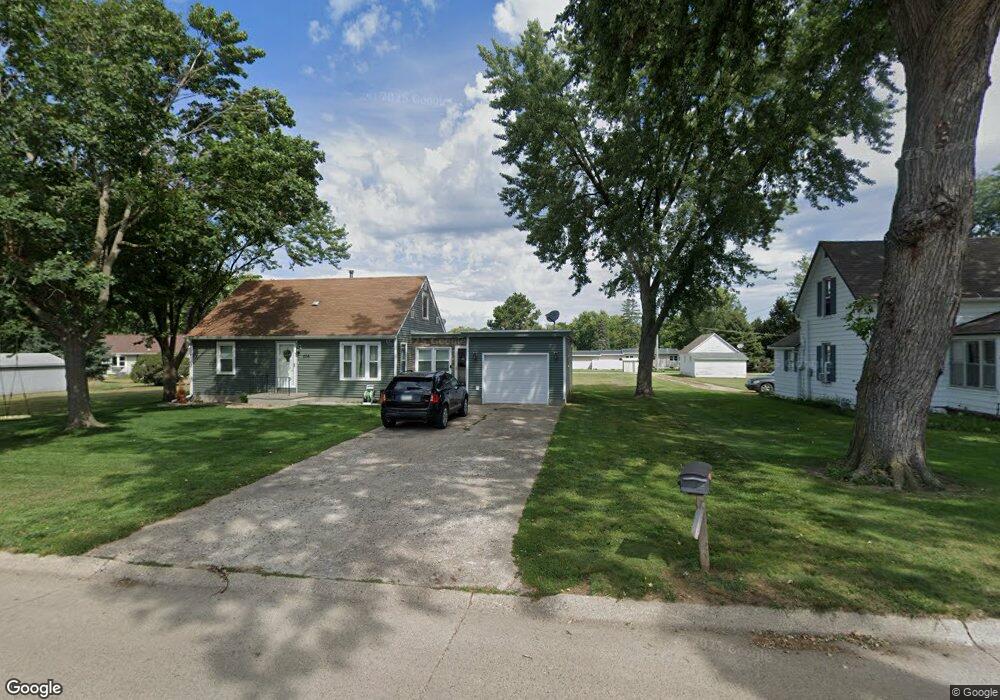
206 E Fenton St Marcus, IA 51035
Estimated Value: $142,000 - $196,000
3
Beds
4
Baths
1,280
Sq Ft
$136/Sq Ft
Est. Value
About This Home
This home is located at 206 E Fenton St, Marcus, IA 51035 and is currently estimated at $173,468, approximately $135 per square foot. 206 E Fenton St is a home located in Cherokee County with nearby schools including MMCRU Marcus Elementary School and MMCRU High School.
Ownership History
Date
Name
Owned For
Owner Type
Purchase Details
Closed on
Jul 27, 2022
Sold by
Prunty Tyler R and Prunty Bailee R
Bought by
Cronin Makenzie
Current Estimated Value
Home Financials for this Owner
Home Financials are based on the most recent Mortgage that was taken out on this home.
Original Mortgage
$142,500
Outstanding Balance
$136,379
Interest Rate
5.81%
Mortgage Type
New Conventional
Estimated Equity
$37,089
Purchase Details
Closed on
Jun 9, 2017
Sold by
Hansen Matthew and Hansen Kayla
Bought by
Nelson Bailee R
Home Financials for this Owner
Home Financials are based on the most recent Mortgage that was taken out on this home.
Original Mortgage
$75,757
Interest Rate
4.03%
Mortgage Type
New Conventional
Create a Home Valuation Report for This Property
The Home Valuation Report is an in-depth analysis detailing your home's value as well as a comparison with similar homes in the area
Purchase History
| Date | Buyer | Sale Price | Title Company |
|---|---|---|---|
| Cronin Makenzie | $162,500 | -- | |
| Nelson Bailee R | $75,000 | None Available |
Source: Public Records
Mortgage History
| Date | Status | Borrower | Loan Amount |
|---|---|---|---|
| Open | Cronin Makenzie | $142,500 | |
| Previous Owner | Nelson Bailee R | $75,757 |
Source: Public Records
Tax History
| Year | Tax Paid | Tax Assessment Tax Assessment Total Assessment is a certain percentage of the fair market value that is determined by local assessors to be the total taxable value of land and additions on the property. | Land | Improvement |
|---|---|---|---|---|
| 2025 | $1,998 | $163,220 | $14,720 | $148,500 |
| 2024 | $1,998 | $152,110 | $14,720 | $137,390 |
| 2023 | $1,052 | $152,110 | $14,720 | $137,390 |
| 2022 | $1,064 | $73,330 | $14,720 | $58,610 |
| 2021 | $1,064 | $73,330 | $14,720 | $58,610 |
| 2020 | $1,036 | $73,330 | $14,720 | $58,610 |
| 2019 | $1,064 | $73,330 | $0 | $0 |
| 2018 | $1,124 | $77,189 | $0 | $0 |
| 2017 | $1,124 | $77,189 | $0 | $0 |
| 2016 | $1,178 | $77,189 | $0 | $0 |
| 2015 | $1,048 | $65,973 | $0 | $0 |
| 2014 | $1,048 | $65,973 | $0 | $0 |
Source: Public Records
Map
Nearby Homes
- 208 E Fenton St
- 211 S Locust St
- 210 E Fenton St
- 205 S Locust St
- 207 S Locust St
- 205 E Fenton St
- 207 Barnes St
- 203 E Barnes St
- 203 S Locust St
- 200 Ridgeway Dr
- 301 Barnes St
- 304 E Fenton St
- 203 E Fenton St
- 201 S Locust St
- 201 E Fenton St
- 201 E Fenton St Unit St
- 101 E Fenton St
- 208 S Locust St
- 208 S Locust St Unit S
- 208 S Locust St Unit St
Your Personal Tour Guide
Ask me questions while you tour the home.