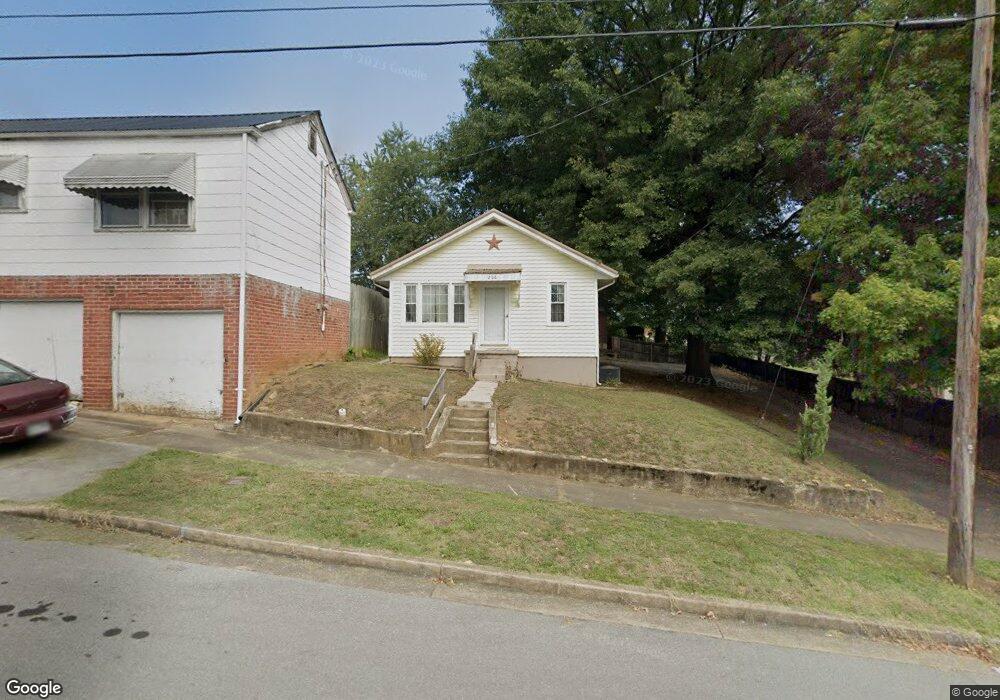
206 E H St Elizabethton, TN 37643
Estimated Value: $131,000 - $195,000
2
Beds
1
Bath
1,122
Sq Ft
$155/Sq Ft
Est. Value
About This Home
This home is located at 206 E H St, Elizabethton, TN 37643 and is currently estimated at $174,361, approximately $155 per square foot. 206 E H St is a home located in Carter County with nearby schools including Elizabethton High School and East Tn Christian Home & Academy.
Ownership History
Date
Name
Owned For
Owner Type
Purchase Details
Closed on
Apr 4, 2016
Sold by
Williams Dale E
Bought by
Cairnes Taylor H
Current Estimated Value
Home Financials for this Owner
Home Financials are based on the most recent Mortgage that was taken out on this home.
Original Mortgage
$79,177
Outstanding Balance
$62,819
Interest Rate
3.64%
Mortgage Type
New Conventional
Estimated Equity
$111,542
Purchase Details
Closed on
Jan 31, 2011
Sold by
Thomas Elizabeth Carolyn
Bought by
Williams Dale E
Purchase Details
Closed on
Oct 29, 1959
Bought by
Bowman Thelma
Create a Home Valuation Report for This Property
The Home Valuation Report is an in-depth analysis detailing your home's value as well as a comparison with similar homes in the area
Home Values in the Area
Average Home Value in this Area
Purchase History
| Date | Buyer | Sale Price | Title Company |
|---|---|---|---|
| Cairnes Taylor H | $77,000 | -- | |
| Williams Dale E | $35,000 | -- | |
| Bowman Thelma | -- | -- |
Source: Public Records
Mortgage History
| Date | Status | Borrower | Loan Amount |
|---|---|---|---|
| Open | Cairnes Taylor H | $79,177 |
Source: Public Records
Tax History Compared to Growth
Tax History
| Year | Tax Paid | Tax Assessment Tax Assessment Total Assessment is a certain percentage of the fair market value that is determined by local assessors to be the total taxable value of land and additions on the property. | Land | Improvement |
|---|---|---|---|---|
| 2024 | $810 | $24,550 | $8,400 | $16,150 |
| 2023 | $810 | $24,550 | $0 | $0 |
| 2022 | $883 | $24,550 | $8,400 | $16,150 |
| 2021 | $498 | $24,550 | $8,400 | $16,150 |
| 2020 | $805 | $24,550 | $8,400 | $16,150 |
| 2019 | $805 | $18,625 | $4,400 | $14,225 |
| 2018 | $793 | $18,625 | $4,400 | $14,225 |
| 2017 | $793 | $18,625 | $4,400 | $14,225 |
| 2016 | $789 | $18,625 | $4,400 | $14,225 |
| 2015 | $792 | $18,625 | $4,400 | $14,225 |
| 2014 | $803 | $18,800 | $4,400 | $14,400 |
Source: Public Records
Map
Nearby Homes