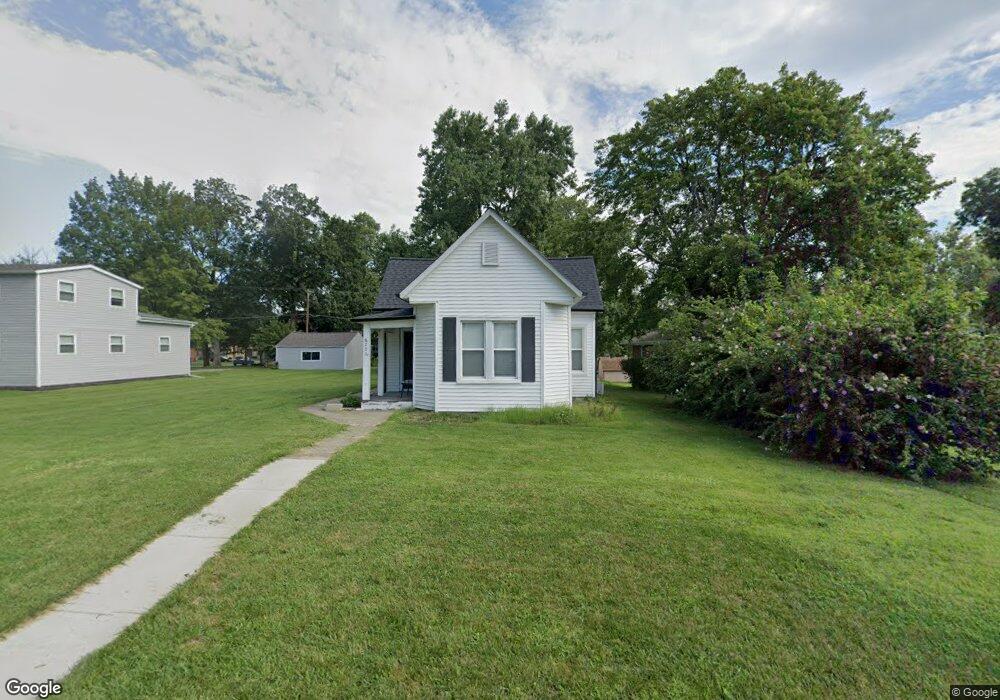
206 E Jefferson St O Fallon, IL 62269
Estimated Value: $89,000 - $140,000
Studio
--
Bath
840
Sq Ft
$141/Sq Ft
Est. Value
About This Home
This home is located at 206 E Jefferson St, O Fallon, IL 62269 and is currently estimated at $118,673, approximately $141 per square foot. 206 E Jefferson St is a home located in St. Clair County with nearby schools including Kampmeyer Elementary School, Carriel Junior High School, and O'Fallon Township High School.
Ownership History
Date
Name
Owned For
Owner Type
Purchase Details
Closed on
Sep 19, 2016
Sold by
Townsend Kevin A and Townsend Carla A
Bought by
App Investments Llc
Current Estimated Value
Purchase Details
Closed on
May 7, 2003
Sold by
Graham J D and Graham Amy K
Bought by
Townsend Kevin A and Townsend Carla A
Home Financials for this Owner
Home Financials are based on the most recent Mortgage that was taken out on this home.
Original Mortgage
$65,000
Interest Rate
6%
Mortgage Type
Purchase Money Mortgage
Purchase Details
Closed on
Mar 3, 2003
Sold by
Berger Tiffany G
Bought by
Graham J D and Graham Amy
Purchase Details
Closed on
Dec 2, 2002
Sold by
Graham J D and Graham Amy
Bought by
Berger Tiffany G
Purchase Details
Closed on
Jan 2, 2002
Sold by
Graham J D
Bought by
Graham J D and Graham Amy
Purchase Details
Closed on
Dec 31, 2001
Sold by
Graham John Tyson
Bought by
Graham J D and Graham Amy
Create a Home Valuation Report for This Property
The Home Valuation Report is an in-depth analysis detailing your home's value as well as a comparison with similar homes in the area
Home Values in the Area
Average Home Value in this Area
Purchase History
| Date | Buyer | Sale Price | Title Company |
|---|---|---|---|
| App Investments Llc | -- | Accommodation | |
| Townsend Kevin A | $65,000 | -- | |
| Graham J D | -- | -- | |
| Berger Tiffany G | -- | -- | |
| Graham J D | -- | -- | |
| Graham J D | -- | -- |
Source: Public Records
Mortgage History
| Date | Status | Borrower | Loan Amount |
|---|---|---|---|
| Previous Owner | Townsend Kevin A | $65,000 |
Source: Public Records
Tax History
| Year | Tax Paid | Tax Assessment Tax Assessment Total Assessment is a certain percentage of the fair market value that is determined by local assessors to be the total taxable value of land and additions on the property. | Land | Improvement |
|---|---|---|---|---|
| 2024 | $2,260 | $30,998 | $4,661 | $26,337 |
| 2023 | $2,084 | $27,512 | $4,137 | $23,375 |
| 2022 | $1,971 | $25,293 | $3,803 | $21,490 |
| 2021 | $1,893 | $23,842 | $3,815 | $20,027 |
| 2020 | $1,880 | $22,568 | $3,611 | $18,957 |
| 2019 | $1,840 | $22,568 | $3,611 | $18,957 |
| 2018 | $1,792 | $21,913 | $3,506 | $18,407 |
| 2017 | $1,865 | $21,985 | $3,655 | $18,330 |
| 2016 | $1,860 | $21,472 | $3,570 | $17,902 |
| 2014 | $1,723 | $21,224 | $3,529 | $17,695 |
| 2013 | $1,394 | $21,581 | $3,475 | $18,106 |
Source: Public Records
Map
Nearby Homes
- 104 W Jackson St
- 201 W Washington St
- 408 E Washington St
- 204 W State St
- 303 N Cedar St
- 504 Fontainebleau
- 205 E 2nd St
- 311 E 2nd St
- 26 Ravenwood Cir
- 604 N Smiley St
- 308 Mulberry Ln
- 708 N Smiley St
- 212 W 4th St
- 206 Westwood Dr
- 904 MacEs Grove Rd
- 418 W 3rd St
- 914 Reiss Rd
- 620 Springhill Ct
- 415 W 3rd St
- 621 E Wesley Dr
- 202 E Jefferson St
- 208 E Jefferson St
- 416 N Vine St
- 205 E Madison St
- 205 E Jefferson St
- 112 E Jefferson St
- 203 E Jefferson St
- 420 N Vine St
- 207 E Jefferson St
- 220 E Jefferson St
- 201 E Jefferson St
- 110 E Jefferson St
- 211 E Jefferson St
- 222 E Jefferson St
- 413 N Vine St
- 423 N Penn St
- 423 N Penn St
- 108 E Jefferson St
- 319 N Vine St
- 113 E Madison St
Your Personal Tour Guide
Ask me questions while you tour the home.