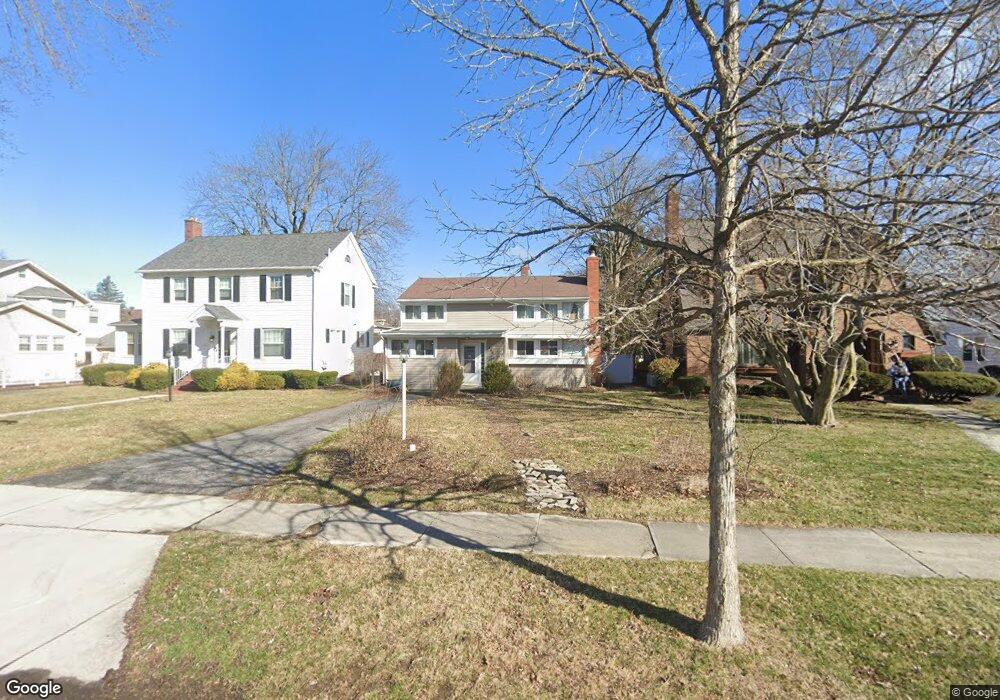
206 E Mcpherson Ave Findlay, OH 45840
Estimated Value: $224,738 - $277,000
3
Beds
2
Baths
1,776
Sq Ft
$142/Sq Ft
Est. Value
About This Home
This home is located at 206 E Mcpherson Ave, Findlay, OH 45840 and is currently estimated at $252,685, approximately $142 per square foot. 206 E Mcpherson Ave is a home located in Hancock County with nearby schools including Jefferson Elementary School, Chamberlin Hill Elementary School, and Donnell Middle School.
Ownership History
Date
Name
Owned For
Owner Type
Purchase Details
Closed on
Sep 30, 2019
Sold by
Barger Jack A and Barger Andrea E
Bought by
Dillon Kaden A and Benitez Hilary M
Current Estimated Value
Home Financials for this Owner
Home Financials are based on the most recent Mortgage that was taken out on this home.
Original Mortgage
$164,900
Outstanding Balance
$144,461
Interest Rate
3.5%
Mortgage Type
New Conventional
Estimated Equity
$108,224
Purchase Details
Closed on
Jun 17, 2005
Sold by
Phillips Pamela and Phillips Fred
Bought by
Barger Jack A and Barger Andrea E
Home Financials for this Owner
Home Financials are based on the most recent Mortgage that was taken out on this home.
Original Mortgage
$120,000
Interest Rate
5.87%
Mortgage Type
Purchase Money Mortgage
Purchase Details
Closed on
Jul 8, 1983
Bought by
Phillips Donald E
Create a Home Valuation Report for This Property
The Home Valuation Report is an in-depth analysis detailing your home's value as well as a comparison with similar homes in the area
Home Values in the Area
Average Home Value in this Area
Purchase History
| Date | Buyer | Sale Price | Title Company |
|---|---|---|---|
| Dillon Kaden A | $170,000 | None Available | |
| Barger Jack A | $128,000 | -- | |
| Phillips Donald E | -- | -- |
Source: Public Records
Mortgage History
| Date | Status | Borrower | Loan Amount |
|---|---|---|---|
| Open | Dillon Kaden A | $164,900 | |
| Closed | Barger Jack A | $120,000 |
Source: Public Records
Tax History
| Year | Tax Paid | Tax Assessment Tax Assessment Total Assessment is a certain percentage of the fair market value that is determined by local assessors to be the total taxable value of land and additions on the property. | Land | Improvement |
|---|---|---|---|---|
| 2024 | $2,098 | $59,050 | $9,280 | $49,770 |
| 2023 | $2,101 | $59,050 | $9,280 | $49,770 |
| 2022 | $2,094 | $59,050 | $9,280 | $49,770 |
| 2021 | $2,137 | $52,490 | $9,520 | $42,970 |
| 2020 | $2,137 | $52,490 | $9,520 | $42,970 |
| 2019 | $2,079 | $52,130 | $9,520 | $42,610 |
| 2018 | $1,812 | $41,630 | $5,950 | $35,680 |
| 2017 | $905 | $41,630 | $5,950 | $35,680 |
| 2016 | $1,788 | $41,630 | $5,950 | $35,680 |
| 2015 | $1,678 | $38,360 | $5,950 | $32,410 |
| 2014 | $1,678 | $38,360 | $5,950 | $32,410 |
| 2012 | $1,563 | $35,420 | $5,950 | $29,470 |
Source: Public Records
Map
Nearby Homes
- 200 E Mcpherson Ave
- 210 E Mcpherson Ave
- 214 E Mcpherson Ave
- 132 E Mcpherson Ave
- 203 Greenlawn Ave
- 201 Greenlawn Ave
- 205 Greenlawn Ave
- 130 E Mcpherson Ave
- 207 Greenlawn Ave
- 131 Greenlawn Ave
- 209 Greenlawn Ave
- 127 Greenlawn Ave
- 120 E Mcpherson Ave
- 209 E Mcpherson Ave
- 201 E Mcpherson Ave
- 123 Greenlawn Ave
- 133 E Mcpherson Ave
- 300 E Mcpherson Ave
- 215 E Mcpherson Ave
- 127 E Mcpherson Ave
Your Personal Tour Guide
Ask me questions while you tour the home.