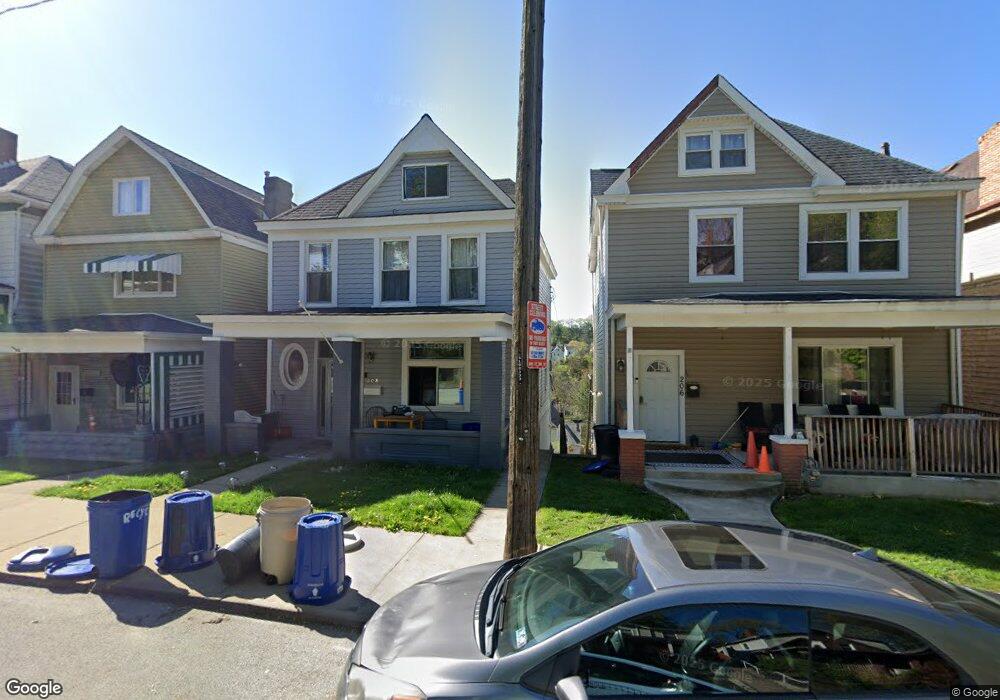
206 E Meyers Ave Pittsburgh, PA 15210
Carrick NeighborhoodEstimated Value: $155,000 - $196,000
6
Beds
2
Baths
1,901
Sq Ft
$93/Sq Ft
Est. Value
About This Home
This home is located at 206 E Meyers Ave, Pittsburgh, PA 15210 and is currently estimated at $176,063, approximately $92 per square foot. 206 E Meyers Ave is a home located in Allegheny County with nearby schools including Pittsburgh Roosevelt K. - 5, Pittsburgh South Brook, and Pittsburgh Carrick High School.
Ownership History
Date
Name
Owned For
Owner Type
Purchase Details
Closed on
Nov 20, 2020
Sold by
Vandervort Anthony J
Bought by
Green Ashanna Tanisha and Smart Paris Lashay
Current Estimated Value
Home Financials for this Owner
Home Financials are based on the most recent Mortgage that was taken out on this home.
Original Mortgage
$139,428
Outstanding Balance
$124,071
Interest Rate
2.8%
Mortgage Type
FHA
Estimated Equity
$51,992
Purchase Details
Closed on
May 7, 2012
Sold by
Walsack Linda
Bought by
Vandervort Gary Edward
Purchase Details
Closed on
Jul 31, 2000
Sold by
Rutter Rutter W and Rutter Joyce A
Bought by
Fluhme Betsy
Purchase Details
Closed on
Jul 27, 2000
Sold by
Household Finance Consumer Discount Co
Bought by
Walsack Carl and Walsack Linda
Purchase Details
Closed on
Mar 28, 2000
Sold by
Alcorn Luella E
Bought by
Household Finance Consumer Discount Co
Create a Home Valuation Report for This Property
The Home Valuation Report is an in-depth analysis detailing your home's value as well as a comparison with similar homes in the area
Home Values in the Area
Average Home Value in this Area
Purchase History
| Date | Buyer | Sale Price | Title Company |
|---|---|---|---|
| Green Ashanna Tanisha | $142,000 | Brokers Settlement Services | |
| Vandervort Gary Edward | $26,000 | -- | |
| Fluhme Betsy | $258,000 | -- | |
| Walsack Carl | $20,000 | -- | |
| Household Finance Consumer Discount Co | -- | -- |
Source: Public Records
Mortgage History
| Date | Status | Borrower | Loan Amount |
|---|---|---|---|
| Open | Green Ashanna Tanisha | $139,428 |
Source: Public Records
Tax History Compared to Growth
Tax History
| Year | Tax Paid | Tax Assessment Tax Assessment Total Assessment is a certain percentage of the fair market value that is determined by local assessors to be the total taxable value of land and additions on the property. | Land | Improvement |
|---|---|---|---|---|
| 2025 | $802 | $34,800 | $13,300 | $21,500 |
| 2024 | $802 | $34,800 | $13,300 | $21,500 |
| 2023 | $802 | $34,800 | $13,300 | $21,500 |
| 2022 | $791 | $34,800 | $13,300 | $21,500 |
| 2021 | $791 | $34,800 | $13,300 | $21,500 |
| 2020 | $380 | $34,800 | $13,300 | $21,500 |
| 2019 | $380 | $16,800 | $13,300 | $3,500 |
| 2018 | $212 | $16,800 | $13,300 | $3,500 |
| 2017 | $380 | $16,800 | $13,300 | $3,500 |
| 2016 | $165 | $34,800 | $13,300 | $21,500 |
| 2015 | $165 | $34,800 | $13,300 | $21,500 |
| 2014 | $770 | $34,800 | $13,300 | $21,500 |
Source: Public Records
Map
Nearby Homes
- 206 Alries St
- 228 Alries St
- 244-246 E Meyers St
- 254 Alries St
- 12 E Meyers St
- 1607 Fredell St
- 203 Birmingham Ave
- 1401 Amanda St
- 119 Birmingham Ave Unit 117
- 119 Birmingham Ave
- 1611 Westmont Ave
- 230 Linnview Ave
- 108 Linnview Ave
- 201 Linnview Ave
- 1641 Mount Joseph St
- 2000 Brownsville Rd
- 147 Laughlin Ave
- 2020 Brownsville Rd
- 1136 Brownsville Rd
- 932 E Warrington Ave
- 206 E Meyers St
- 208 E Meyers Ave
- 204 E Meyers Ave
- 210 E Meyers Ave
- 200 E Meyers Ave
- 212 E Meyers Ave
- 130 E Meyers Ave
- 214 E Meyers Ave
- 209 Alries St
- 201 Alries St
- 128 E Meyers Ave
- 215 Alries St
- 207 E Meyers Ave
- 205 E Meyers Ave
- 216 E Meyers Ave
- 209 E Meyers Ave
- 203 E Meyers Ave
- 211 E Meyers Ave
- 126 E Meyers Ave
- 213 E Meyers St