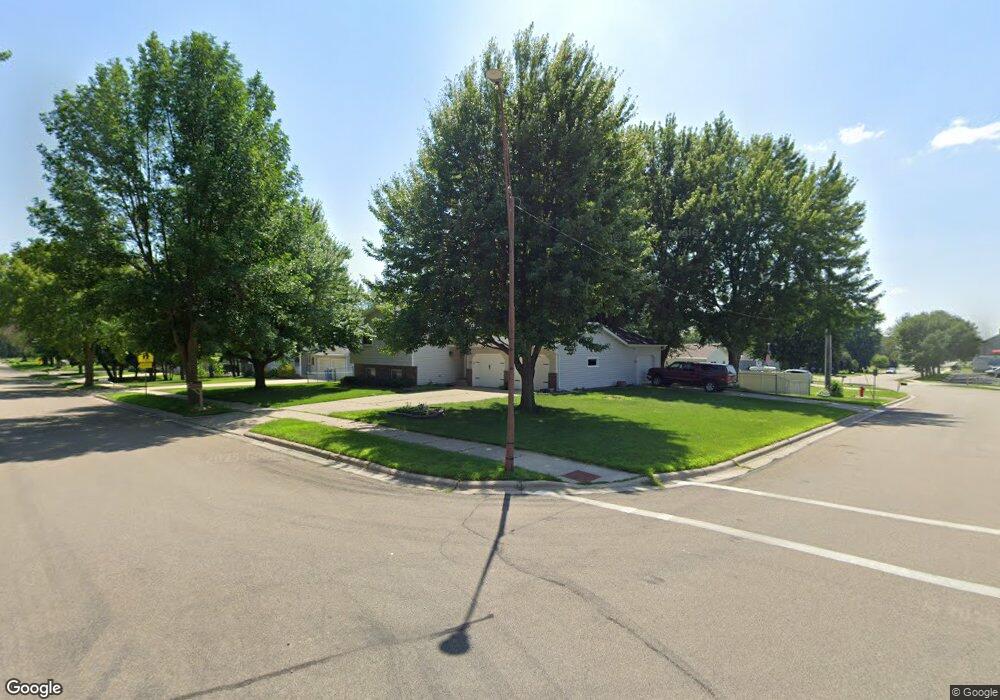
206 Hilltop Ave Owatonna, MN 55060
Estimated Value: $272,000 - $306,000
4
Beds
2
Baths
1,867
Sq Ft
$153/Sq Ft
Est. Value
About This Home
This home is located at 206 Hilltop Ave, Owatonna, MN 55060 and is currently estimated at $285,347, approximately $152 per square foot. 206 Hilltop Ave is a home located in Steele County with nearby schools including Wilson Elementary School, Owatonna Middle School, and Owatonna Senior High School.
Ownership History
Date
Name
Owned For
Owner Type
Purchase Details
Closed on
Sep 30, 2020
Sold by
Burshem Danielle D
Bought by
Burow Clay R and Goettl Rileigh E
Current Estimated Value
Home Financials for this Owner
Home Financials are based on the most recent Mortgage that was taken out on this home.
Original Mortgage
$177,300
Outstanding Balance
$157,699
Interest Rate
2.9%
Mortgage Type
New Conventional
Estimated Equity
$127,648
Purchase Details
Closed on
Dec 17, 2015
Sold by
Hud
Bought by
Burshem Danielle D
Purchase Details
Closed on
Jan 27, 2015
Sold by
Bank Of America
Bought by
Hud
Purchase Details
Closed on
Nov 21, 2009
Sold by
Steele County Sheriff
Bought by
Mers Inc
Purchase Details
Closed on
Aug 21, 2006
Sold by
Weathers Ronald E and Weathers Phyllis J
Bought by
Mans Lawrence G
Create a Home Valuation Report for This Property
The Home Valuation Report is an in-depth analysis detailing your home's value as well as a comparison with similar homes in the area
Home Values in the Area
Average Home Value in this Area
Purchase History
| Date | Buyer | Sale Price | Title Company |
|---|---|---|---|
| Burow Clay R | $197,000 | None Available | |
| Burshem Danielle D | -- | -- | |
| Hud | -- | -- | |
| Mers Inc | $192,689 | -- | |
| Mans Lawrence G | $180,000 | North American Title Company |
Source: Public Records
Mortgage History
| Date | Status | Borrower | Loan Amount |
|---|---|---|---|
| Open | Burow Clay R | $177,300 |
Source: Public Records
Tax History Compared to Growth
Tax History
| Year | Tax Paid | Tax Assessment Tax Assessment Total Assessment is a certain percentage of the fair market value that is determined by local assessors to be the total taxable value of land and additions on the property. | Land | Improvement |
|---|---|---|---|---|
| 2025 | $3,308 | $271,800 | $55,500 | $216,300 |
| 2024 | $3,326 | $240,900 | $40,000 | $200,900 |
| 2023 | $3,328 | $233,000 | $35,800 | $197,200 |
| 2022 | $2,840 | $223,100 | $34,000 | $189,100 |
| 2021 | $2,778 | $175,812 | $29,302 | $146,510 |
| 2020 | $3,522 | $170,618 | $29,302 | $141,316 |
| 2019 | $3,270 | $169,736 | $32,536 | $137,200 |
| 2018 | $3,160 | $164,346 | $32,536 | $131,810 |
| 2017 | $3,044 | $157,094 | $34,006 | $123,088 |
| 2016 | $3,434 | $150,626 | $34,006 | $116,620 |
| 2015 | -- | $0 | $0 | $0 |
| 2014 | -- | $0 | $0 | $0 |
Source: Public Records
Map
Nearby Homes
- 206 Selby Ave
- 116 Selby Ave
- 360 Thomas Ave
- 468 Mound St
- 640 Lemond Rd
- 420 Fairview St
- 540 Allan Ave
- 840 SW Riverwood Place
- 919 Mosher Ave
- 421 S Oak Ave
- 916 Linn Ave SW
- xxx Anderson Place
- 1138 Hawthorne Ave
- 1015 Grandview Ave
- 1031 Grandview Ave
- 1052 Grandview Ave
- 819 S Cedar Ave
- 604 S Elm Ave
- 1047 S Oak Ave
- 332 13th St SW
- 210 Hilltop Ave
- 655 Mound St
- 661 Mound St
- 203 Hilltop Ave
- 211 Hilltop Ave
- 224 Hilltop Ave
- 636 Lynwood St
- 636 Lynnwood Dr
- 640 Mound St
- 663 Mound St
- 646 Lynnwood Dr
- 223 Hilltop Ave
- 620 Mound St
- 612 Mound St
- 660 Lynnwood Dr
- 660 660 Lynwood-Drive-
- 660 Lynwood St
- 216 Selby Ave
- 660 Lynnwood Dr
- 233 Hilltop Ave