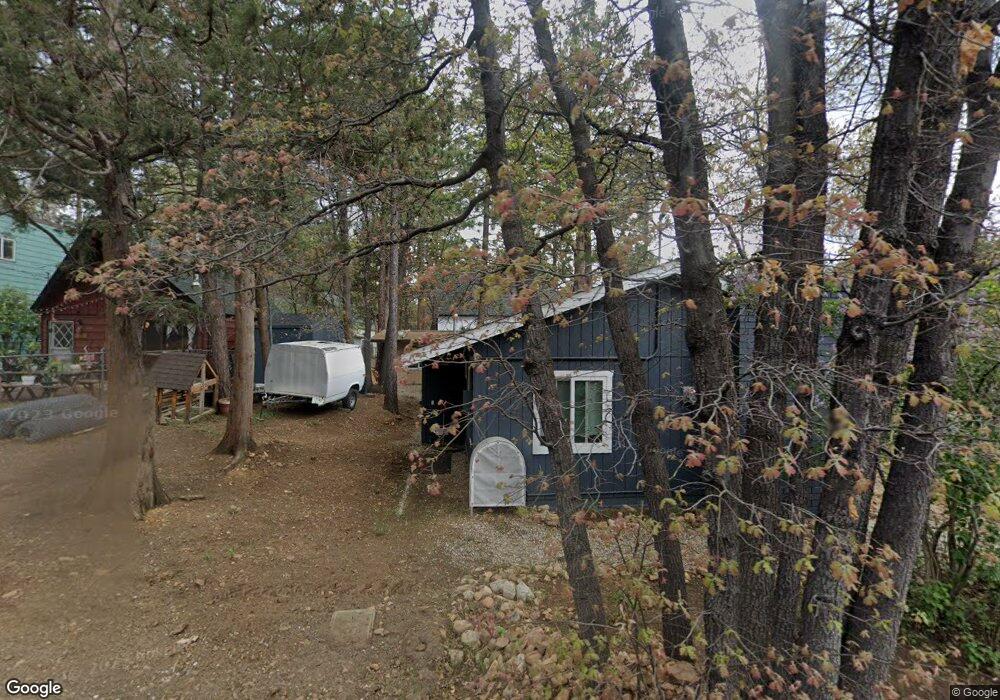
206 Holmes Ln Sugarloaf, CA 92386
Estimated Value: $219,000 - $267,076
2
Beds
1
Bath
660
Sq Ft
$366/Sq Ft
Est. Value
About This Home
This home is located at 206 Holmes Ln, Sugarloaf, CA 92386 and is currently estimated at $241,769, approximately $366 per square foot. 206 Holmes Ln is a home with nearby schools including Baldwin Lane Elementary School, Big Bear Middle School, and Big Bear High School.
Ownership History
Date
Name
Owned For
Owner Type
Purchase Details
Closed on
Mar 26, 2019
Sold by
Mulkey Michael J and Mulkey Vicky J
Bought by
Berg Garry W and Berg Linda M
Current Estimated Value
Home Financials for this Owner
Home Financials are based on the most recent Mortgage that was taken out on this home.
Original Mortgage
$70,000
Outstanding Balance
$61,542
Interest Rate
4.3%
Mortgage Type
New Conventional
Estimated Equity
$180,227
Purchase Details
Closed on
Feb 20, 2006
Sold by
Broneau Michael J and Broneau Mark J
Bought by
Mulkey Michael J and Mulkey Vicky J
Home Financials for this Owner
Home Financials are based on the most recent Mortgage that was taken out on this home.
Original Mortgage
$70,000
Interest Rate
6.19%
Mortgage Type
Fannie Mae Freddie Mac
Purchase Details
Closed on
Feb 23, 2005
Sold by
Broneau Michelle Janean
Bought by
Broneau Michelle Janean
Purchase Details
Closed on
Dec 27, 1995
Sold by
Broneau Michael J and Broneau Charles William
Bought by
Broneau Michael J and Broneau Mark J
Create a Home Valuation Report for This Property
The Home Valuation Report is an in-depth analysis detailing your home's value as well as a comparison with similar homes in the area
Home Values in the Area
Average Home Value in this Area
Purchase History
| Date | Buyer | Sale Price | Title Company |
|---|---|---|---|
| Berg Garry W | $125,000 | Lawyers Title Ie | |
| Mulkey Michael J | $185,000 | Chicago Title Co | |
| Broneau Michelle Janean | -- | -- | |
| Broneau Michael J | -- | -- |
Source: Public Records
Mortgage History
| Date | Status | Borrower | Loan Amount |
|---|---|---|---|
| Open | Berg Garry W | $70,000 | |
| Previous Owner | Mulkey Michael J | $70,000 |
Source: Public Records
Tax History
| Year | Tax Paid | Tax Assessment Tax Assessment Total Assessment is a certain percentage of the fair market value that is determined by local assessors to be the total taxable value of land and additions on the property. | Land | Improvement |
|---|---|---|---|---|
| 2025 | $2,844 | $139,439 | $27,888 | $111,551 |
| 2024 | $2,708 | $136,705 | $27,341 | $109,364 |
| 2023 | $2,612 | $134,025 | $26,805 | $107,220 |
| 2022 | $2,502 | $131,397 | $26,279 | $105,118 |
| 2021 | $2,442 | $128,821 | $25,764 | $103,057 |
| 2020 | $2,432 | $127,500 | $25,500 | $102,000 |
| 2019 | $2,755 | $160,000 | $45,000 | $115,000 |
| 2018 | $2,583 | $150,500 | $40,500 | $110,000 |
| 2017 | $2,431 | $140,000 | $37,700 | $102,300 |
| 2016 | $2,327 | $133,300 | $35,900 | $97,400 |
| 2015 | $2,274 | $130,000 | $35,000 | $95,000 |
| 2014 | $2,040 | $110,000 | $30,000 | $80,000 |
Source: Public Records
Map
Nearby Homes
Your Personal Tour Guide
Ask me questions while you tour the home.