206 Keenan Ln Shelbyville, TN 37160
Estimated Value: $266,010 - $368,000
--
Bed
2
Baths
1,996
Sq Ft
$164/Sq Ft
Est. Value
About This Home
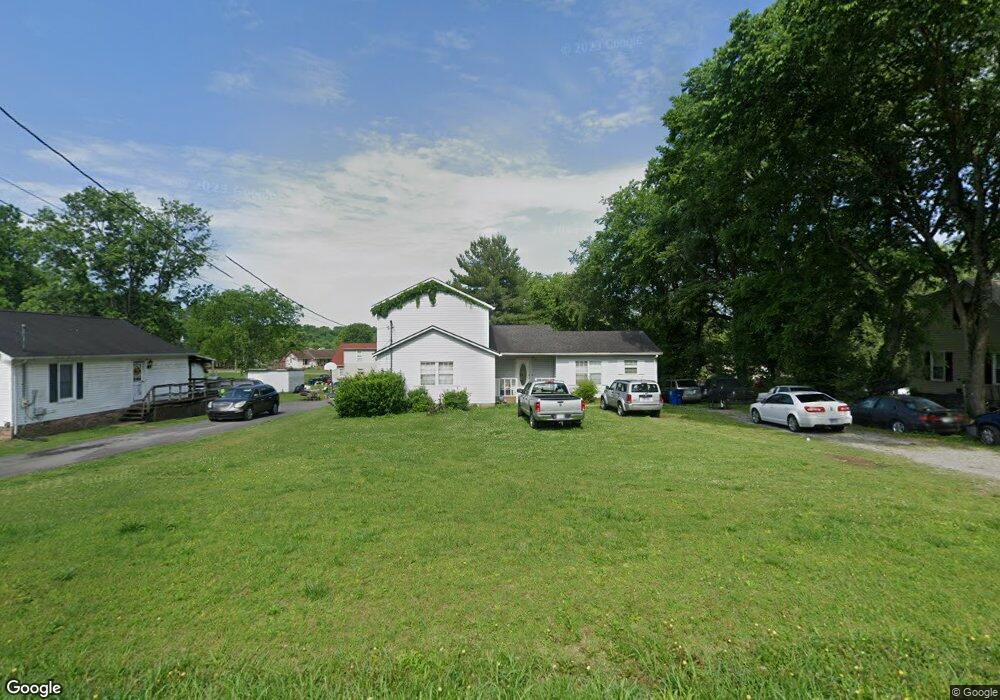
This home is located at 206 Keenan Ln, Shelbyville, TN 37160 and is currently estimated at $328,253, approximately $164 per square foot. 206 Keenan Ln is a home located in Bedford County with nearby schools including South Side Elementary School, Harris Middle School, and Christian Chapel Academy.
Ownership History
Date
Name
Owned For
Owner Type
Purchase Details
Closed on
Jan 26, 2001
Sold by
Garrett Judy D Haskins
Bought by
Davis Barry F and Davis Letitia
Current Estimated Value
Purchase Details
Closed on
Jul 30, 1993
Bought by
Haskins Judy D
Purchase Details
Closed on
Jul 13, 1992
Bought by
Koons Tom
Purchase Details
Closed on
Jul 8, 1992
Bought by
Professional Asset Management In Tn Inc
Purchase Details
Closed on
Jun 30, 1992
Bought by
Professional Asset Management Corp Of Tn
Purchase Details
Closed on
Jun 15, 1987
Bought by
Warren Daniel and Warren Nyoka O
Create a Home Valuation Report for This Property
The Home Valuation Report is an in-depth analysis detailing your home's value as well as a comparison with similar homes in the area
Home Values in the Area
Average Home Value in this Area
Purchase History
| Date | Buyer | Sale Price | Title Company |
|---|---|---|---|
| Davis Barry F | $89,600 | -- | |
| Haskins Judy D | $66,000 | -- | |
| Koons Tom | $22,000 | -- | |
| Professional Asset Management In Tn Inc | -- | -- | |
| Professional Asset Management Corp Of Tn | -- | -- | |
| Warren Daniel | -- | -- |
Source: Public Records
Tax History Compared to Growth
Tax History
| Year | Tax Paid | Tax Assessment Tax Assessment Total Assessment is a certain percentage of the fair market value that is determined by local assessors to be the total taxable value of land and additions on the property. | Land | Improvement |
|---|---|---|---|---|
| 2025 | -- | $44,750 | $0 | $0 |
| 2024 | -- | $44,750 | $8,250 | $36,500 |
| 2023 | $662 | $44,750 | $8,250 | $36,500 |
| 2022 | $1,753 | $44,750 | $8,250 | $36,500 |
| 2021 | $1,591 | $44,750 | $8,250 | $36,500 |
| 2020 | $1,358 | $44,750 | $8,250 | $36,500 |
| 2019 | $1,358 | $30,650 | $5,250 | $25,400 |
| 2018 | $1,328 | $30,650 | $5,250 | $25,400 |
| 2017 | $1,328 | $30,650 | $5,250 | $25,400 |
| 2016 | $1,315 | $30,650 | $5,250 | $25,400 |
| 2015 | $1,315 | $30,650 | $5,250 | $25,400 |
| 2014 | $979 | $24,965 | $0 | $0 |
Source: Public Records
Map
Nearby Homes