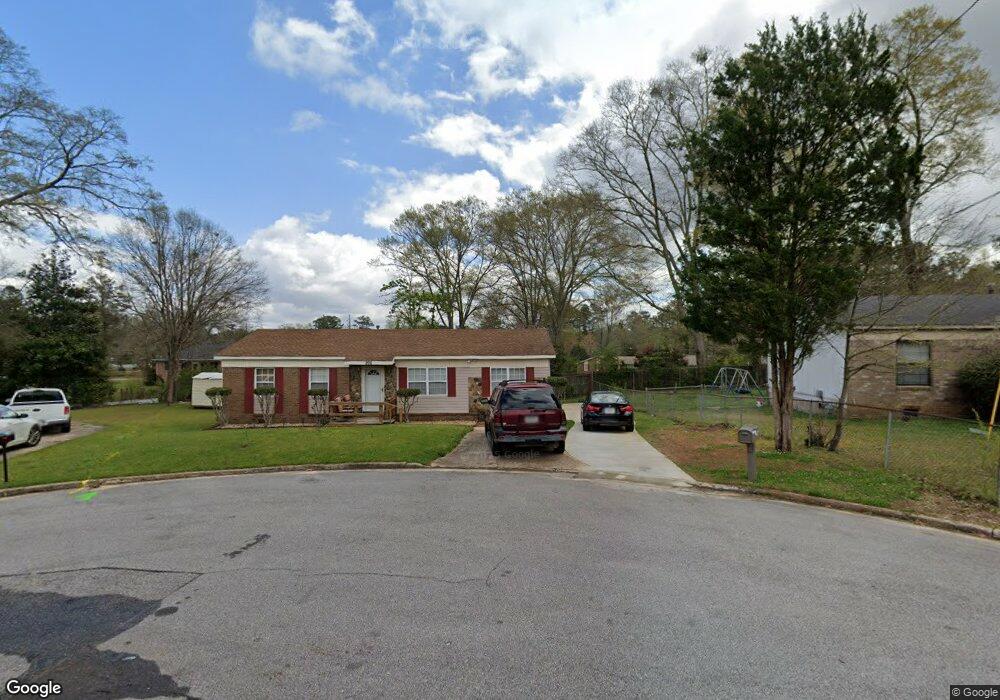
206 Kings Park Ln Lagrange, GA 30241
Estimated Value: $133,089 - $155,000
3
Beds
2
Baths
1,312
Sq Ft
$110/Sq Ft
Est. Value
About This Home
This home is located at 206 Kings Park Ln, Lagrange, GA 30241 and is currently estimated at $144,772, approximately $110 per square foot. 206 Kings Park Ln is a home located in Troup County with nearby schools including Callaway Elementary School, Hogansville Elementary School, and Callaway Middle School.
Ownership History
Date
Name
Owned For
Owner Type
Purchase Details
Closed on
Apr 12, 2000
Sold by
Alton Lester
Bought by
Ellis Cheryl J
Current Estimated Value
Purchase Details
Closed on
Aug 10, 1999
Sold by
Nations Credit Fin Serv Corp
Bought by
Alton Lester
Purchase Details
Closed on
May 4, 1999
Sold by
Kitchens C
Bought by
Nations Credit Fin Serv Corp
Purchase Details
Closed on
Jan 30, 1998
Sold by
Talbot State Bank
Bought by
Kitchens C
Purchase Details
Closed on
Dec 9, 1997
Sold by
Woods Joseph
Bought by
Talbot State Bank
Purchase Details
Closed on
Nov 1, 1977
Sold by
Secretary Of Housing & Urban
Bought by
Woods Joseph
Purchase Details
Closed on
Dec 12, 1974
Sold by
Mcghee Doris
Bought by
Secretary Of Housing & Urban
Purchase Details
Closed on
Jan 1, 1972
Sold by
Brooks J D
Bought by
Mcghee Doris
Purchase Details
Closed on
Jan 1, 1971
Bought by
Brooks J D
Create a Home Valuation Report for This Property
The Home Valuation Report is an in-depth analysis detailing your home's value as well as a comparison with similar homes in the area
Home Values in the Area
Average Home Value in this Area
Purchase History
| Date | Buyer | Sale Price | Title Company |
|---|---|---|---|
| Ellis Cheryl J | $65,000 | -- | |
| Alton Lester | $24,000 | -- | |
| Nations Credit Fin Serv Corp | -- | -- | |
| Kitchens C | $22,000 | -- | |
| Talbot State Bank | -- | -- | |
| Woods Joseph | -- | -- | |
| Secretary Of Housing & Urban | -- | -- | |
| Mcghee Doris | $17,400 | -- | |
| Brooks J D | -- | -- |
Source: Public Records
Tax History Compared to Growth
Tax History
| Year | Tax Paid | Tax Assessment Tax Assessment Total Assessment is a certain percentage of the fair market value that is determined by local assessors to be the total taxable value of land and additions on the property. | Land | Improvement |
|---|---|---|---|---|
| 2024 | $1,116 | $42,924 | $4,200 | $38,724 |
| 2023 | $918 | $35,648 | $4,200 | $31,448 |
| 2022 | $870 | $33,168 | $4,200 | $28,968 |
| 2021 | $716 | $25,732 | $3,520 | $22,212 |
| 2020 | $716 | $25,732 | $3,520 | $22,212 |
| 2019 | $648 | $23,464 | $3,520 | $19,944 |
| 2018 | $571 | $20,928 | $3,584 | $17,344 |
| 2017 | $571 | $20,928 | $3,584 | $17,344 |
| 2016 | $554 | $20,346 | $3,584 | $16,762 |
| 2015 | $555 | $20,346 | $3,584 | $16,762 |
| 2014 | $551 | $20,183 | $3,584 | $16,599 |
| 2013 | -- | $21,567 | $3,584 | $17,983 |
Source: Public Records
Map
Nearby Homes
- 114 Brenda Blvd
- 130 Edgewood Ave
- 901 Whiteline St
- 0 E Fendig St
- 113 E Fendig St
- 1404 Hamilton Rd
- 311 Colquitt St
- 213 Euclid Ave
- 216 Euclid Ave
- 0 Boggs St Unit 10550243
- 0 Boggs St Unit 10550231
- 0 Boggs St Unit 10550239
- 0 Boggs St Unit 10550250
- 304 Butler St
- 626 Smoot St
- 510 Smoot St
- 109 Bell St
- 137 Edgewood Ave
- LOT 15 Edgewood Ave
- 0 Brown St Unit 10550761
- 204 Kings Park Ln
- 208 Kings Park Ln
- 210 Kings Park Ln
- 202 Kings Park Ln
- 209 Kings Park Ln
- 718 Miami St
- 712 Miami St
- 212 Kings Park Ln
- 200 Kings Park Ln
- 211 Kings Park Ln
- 100 Royal Ct
- 214 Kings Park Ln
- 0 Kings Park Ln Unit 3255238
- 0 Kings Park Ln Unit 8438487
- 102 Royal Ct
- 134 Kings Park Ln
- 213 Kings Park Ln
- 216 Kings Park Ln
- 708 Miami St
- 711 Miami St