Estimated Value: $1,176,000 - $2,290,000
4
Beds
4
Baths
3,522
Sq Ft
$550/Sq Ft
Est. Value
About This Home
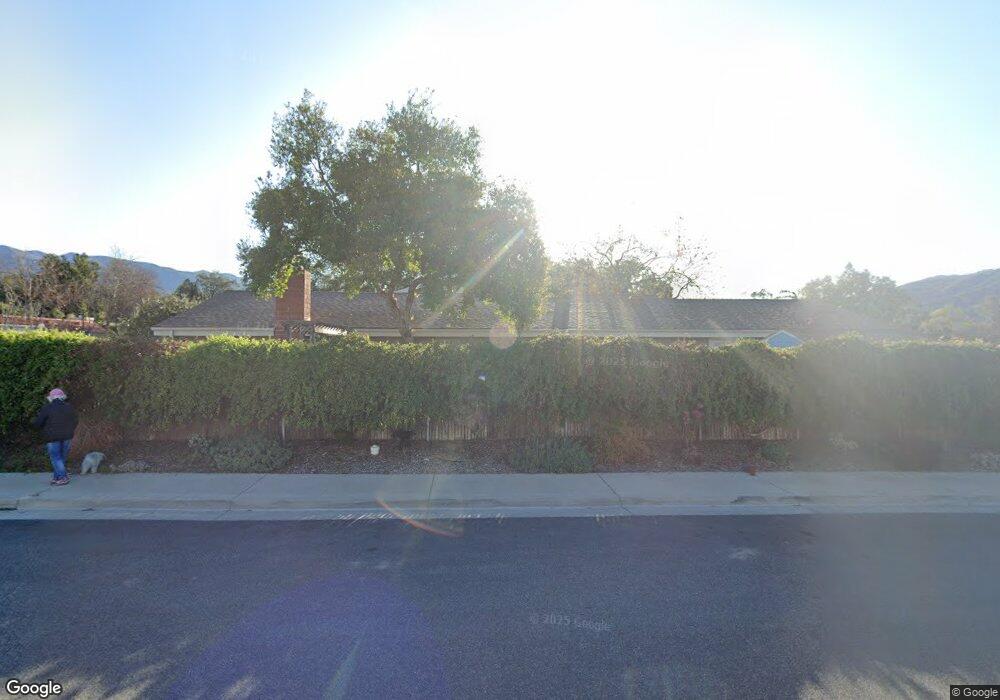
This home is located at 206 Lark Ellen Ave, Ojai, CA 93023 and is currently estimated at $1,938,695, approximately $550 per square foot. 206 Lark Ellen Ave is a home located in Ventura County with nearby schools including Topa Topa Elementary School, Matilija Junior High, and Legacy High School.
Ownership History
Date
Name
Owned For
Owner Type
Purchase Details
Closed on
Feb 18, 2017
Sold by
Niglio Ernest R and Niglio Mariann
Bought by
Niglio Ernest R and Ariann Niglio L
Current Estimated Value
Purchase Details
Closed on
Feb 8, 2013
Sold by
Morehead Gian and Morehead Penny
Bought by
Niglio Ernest and Niglio Mariann
Home Financials for this Owner
Home Financials are based on the most recent Mortgage that was taken out on this home.
Original Mortgage
$100,000
Outstanding Balance
$70,407
Interest Rate
3.49%
Mortgage Type
Stand Alone Second
Estimated Equity
$1,868,288
Purchase Details
Closed on
Oct 5, 2006
Sold by
Goldstein Louis M and Goldstein Silvester
Bought by
Morehead Gian and Morehead Penny
Home Financials for this Owner
Home Financials are based on the most recent Mortgage that was taken out on this home.
Original Mortgage
$680,000
Interest Rate
5.62%
Mortgage Type
Negative Amortization
Purchase Details
Closed on
Jun 11, 2003
Sold by
Goldstein Louis M
Bought by
Goldstein Diane Silvester
Home Financials for this Owner
Home Financials are based on the most recent Mortgage that was taken out on this home.
Original Mortgage
$260,000
Interest Rate
5.18%
Mortgage Type
Purchase Money Mortgage
Purchase Details
Closed on
May 29, 2003
Sold by
Goldberg Mary
Bought by
Goldstein Louis M and Goldstein Diane Silvester
Home Financials for this Owner
Home Financials are based on the most recent Mortgage that was taken out on this home.
Original Mortgage
$260,000
Interest Rate
5.18%
Mortgage Type
Purchase Money Mortgage
Purchase Details
Closed on
Jan 28, 2002
Sold by
Thompson Charles and Branchflower Justine
Bought by
Goldberg Mary
Home Financials for this Owner
Home Financials are based on the most recent Mortgage that was taken out on this home.
Original Mortgage
$476,250
Interest Rate
6.87%
Purchase Details
Closed on
Jun 10, 1996
Sold by
Thompson Charles Anderson
Bought by
Branchflower Justine Robinson
Home Financials for this Owner
Home Financials are based on the most recent Mortgage that was taken out on this home.
Original Mortgage
$286,125
Interest Rate
5.95%
Purchase Details
Closed on
Jun 4, 1996
Sold by
Loomis Jason Scott
Bought by
Branchflower Justine Robinson
Home Financials for this Owner
Home Financials are based on the most recent Mortgage that was taken out on this home.
Original Mortgage
$286,125
Interest Rate
5.95%
Create a Home Valuation Report for This Property
The Home Valuation Report is an in-depth analysis detailing your home's value as well as a comparison with similar homes in the area
Home Values in the Area
Average Home Value in this Area
Purchase History
| Date | Buyer | Sale Price | Title Company |
|---|---|---|---|
| Niglio Ernest R | -- | None Available | |
| Niglio Ernest R | -- | None Available | |
| Niglio Ernest | $830,000 | Lawyers Title | |
| Morehead Gian | $850,000 | National Title Company | |
| Goldstein Diane Silvester | -- | First American Title Co | |
| Goldstein Louis M | -- | First American Title Co | |
| Goldstein Louis M | $693,000 | First American Title Co | |
| Goldberg Mary | $635,000 | First American Title Ins Co | |
| Branchflower Justine Robinson | -- | First American Title Ins Co | |
| Branchflower Justine Robinson | $381,500 | First American Title Ins Co |
Source: Public Records
Mortgage History
| Date | Status | Borrower | Loan Amount |
|---|---|---|---|
| Open | Niglio Ernest | $100,000 | |
| Open | Niglio Ernest | $598,000 | |
| Previous Owner | Morehead Gian | $680,000 | |
| Previous Owner | Goldstein Louis M | $260,000 | |
| Previous Owner | Goldberg Mary | $476,250 | |
| Previous Owner | Branchflower Justine Robinson | $286,125 |
Source: Public Records
Tax History Compared to Growth
Tax History
| Year | Tax Paid | Tax Assessment Tax Assessment Total Assessment is a certain percentage of the fair market value that is determined by local assessors to be the total taxable value of land and additions on the property. | Land | Improvement |
|---|---|---|---|---|
| 2025 | $12,608 | $1,022,071 | $591,079 | $430,992 |
| 2024 | $12,608 | $1,002,031 | $579,489 | $422,542 |
| 2023 | $12,183 | $982,384 | $568,127 | $414,257 |
| 2022 | $11,991 | $963,122 | $556,987 | $406,135 |
| 2021 | $11,923 | $944,238 | $546,066 | $398,172 |
| 2020 | $11,634 | $934,558 | $540,468 | $394,090 |
| 2019 | $11,296 | $916,234 | $529,871 | $386,363 |
| 2018 | $11,195 | $898,270 | $519,482 | $378,788 |
| 2017 | $10,943 | $880,658 | $509,297 | $371,361 |
| 2016 | $10,224 | $863,391 | $499,311 | $364,080 |
| 2015 | $10,148 | $850,424 | $491,812 | $358,612 |
| 2014 | $9,550 | $833,768 | $482,179 | $351,589 |
Source: Public Records
Map
Nearby Homes
- 288 Lark Ellen Ave
- 1323 Gregory St
- 207 Lark Ellen Ave
- 209 Lark Ellen Ave
- 203 Lark Ellen Ave
- 1321 Gregory St
- 215 Lark Ellen Ave
- 251 Gridley Rd
- 201 Lark Ellen Ave
- 217 Lark Ellen Ave
- 308 Lark Ellen Ave
- 1307 Gregory St
- 1303 Gregory St
- 301 Lark Ellen Ave
- 1309 Gregory St
- 1301 Gregory St
- 1317 Gregory St
- 291 Gridley Rd
- 1315 Gregory St
- 1223 Gregory St