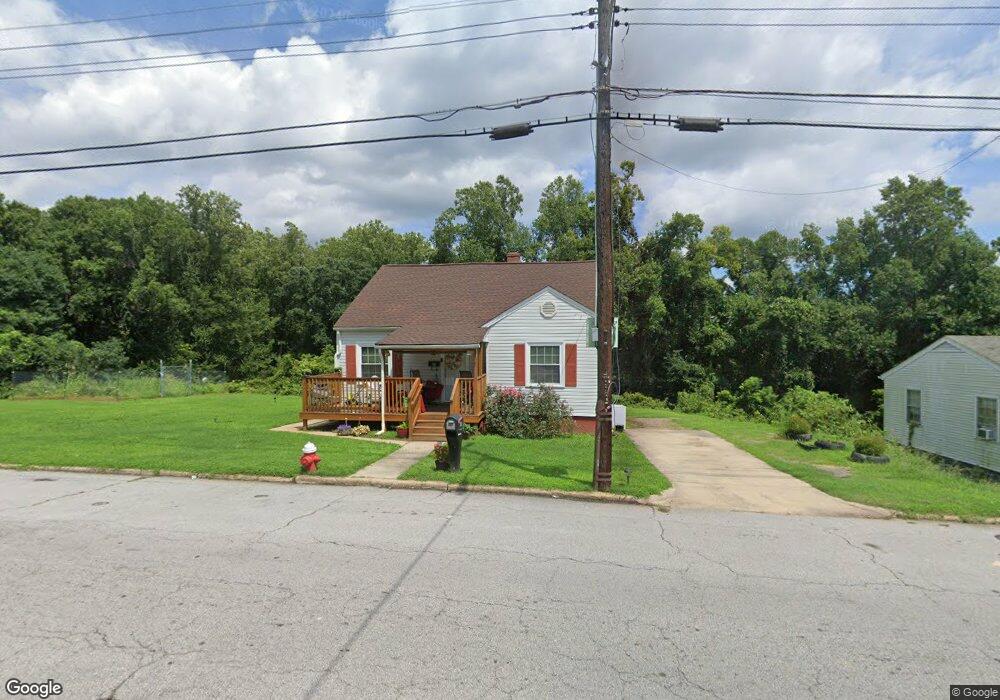
206 Locust Ln Danville, VA 24540
Estimated Value: $102,159 - $121,000
4
Beds
1
Bath
1,401
Sq Ft
$80/Sq Ft
Est. Value
About This Home
This home is located at 206 Locust Ln, Danville, VA 24540 and is currently estimated at $111,790, approximately $79 per square foot. 206 Locust Ln is a home located in Danville City with nearby schools including White Oak School.
Ownership History
Date
Name
Owned For
Owner Type
Purchase Details
Closed on
Sep 27, 2010
Sold by
First State Bank
Bought by
Jones Jillian M
Current Estimated Value
Home Financials for this Owner
Home Financials are based on the most recent Mortgage that was taken out on this home.
Original Mortgage
$51,309
Outstanding Balance
$34,082
Interest Rate
4.48%
Mortgage Type
FHA
Estimated Equity
$77,708
Purchase Details
Closed on
Jul 29, 2009
Sold by
Glasser & Glasser Plc Sub Tr
Bought by
First State Bank
Create a Home Valuation Report for This Property
The Home Valuation Report is an in-depth analysis detailing your home's value as well as a comparison with similar homes in the area
Home Values in the Area
Average Home Value in this Area
Purchase History
| Date | Buyer | Sale Price | Title Company |
|---|---|---|---|
| Jones Jillian M | $52,000 | -- | |
| First State Bank | $63,500 | -- |
Source: Public Records
Mortgage History
| Date | Status | Borrower | Loan Amount |
|---|---|---|---|
| Open | First State Bank | $51,309 |
Source: Public Records
Tax History Compared to Growth
Tax History
| Year | Tax Paid | Tax Assessment Tax Assessment Total Assessment is a certain percentage of the fair market value that is determined by local assessors to be the total taxable value of land and additions on the property. | Land | Improvement |
|---|---|---|---|---|
| 2024 | $452 | $54,400 | $2,500 | $51,900 |
| 2023 | $414 | $49,300 | $2,500 | $46,800 |
| 2022 | $414 | $49,300 | $2,500 | $46,800 |
| 2021 | $419 | $49,900 | $2,500 | $47,400 |
| 2020 | $412 | $49,100 | $2,500 | $46,600 |
| 2019 | $420 | $50,000 | $2,500 | $47,500 |
| 2018 | $400 | $50,000 | $2,500 | $47,500 |
| 2017 | $413 | $51,600 | $3,800 | $47,800 |
| 2016 | $377 | $51,600 | $3,800 | $47,800 |
| 2015 | $384 | $52,600 | $3,800 | $48,800 |
| 2014 | $384 | $52,600 | $3,800 | $48,800 |
Source: Public Records
Map
Nearby Homes