206 MacLeans Cross Ln SE Unit 16 Smyrna, GA 30082
Estimated Value: $368,000 - $423,000
3
Beds
3
Baths
1,929
Sq Ft
$202/Sq Ft
Est. Value
About This Home
This home is located at 206 MacLeans Cross Ln SE Unit 16, Smyrna, GA 30082 and is currently estimated at $389,637, approximately $201 per square foot. 206 MacLeans Cross Ln SE Unit 16 is a home located in Cobb County with nearby schools including Nickajack Elementary School, Campbell Middle School, and Campbell High School.
Ownership History
Date
Name
Owned For
Owner Type
Purchase Details
Closed on
Jun 4, 2010
Sold by
Federal Home Loan Mortgage Corporation
Bought by
Laney Danielle
Current Estimated Value
Home Financials for this Owner
Home Financials are based on the most recent Mortgage that was taken out on this home.
Original Mortgage
$145,046
Outstanding Balance
$98,166
Interest Rate
5.25%
Mortgage Type
FHA
Estimated Equity
$291,471
Purchase Details
Closed on
Nov 3, 2009
Sold by
Onewest Bk Fsb
Bought by
Federal Home Loan Mortgage Corporation
Purchase Details
Closed on
Nov 3, 2008
Sold by
Fernandes Erin
Bought by
Hayes Michael and Hayes Mary
Purchase Details
Closed on
Mar 29, 2005
Sold by
Beazer Homes Corp
Bought by
Fernandes Robert and Fernandes Erin
Home Financials for this Owner
Home Financials are based on the most recent Mortgage that was taken out on this home.
Original Mortgage
$202,500
Interest Rate
7.5%
Mortgage Type
New Conventional
Create a Home Valuation Report for This Property
The Home Valuation Report is an in-depth analysis detailing your home's value as well as a comparison with similar homes in the area
Home Values in the Area
Average Home Value in this Area
Purchase History
| Date | Buyer | Sale Price | Title Company |
|---|---|---|---|
| Laney Danielle | -- | -- | |
| Federal Home Loan Mortgage Corporation | -- | -- | |
| Hayes Michael | $178,199 | -- | |
| Fernandes Robert | $213,200 | -- |
Source: Public Records
Mortgage History
| Date | Status | Borrower | Loan Amount |
|---|---|---|---|
| Open | Laney Danielle | $145,046 | |
| Previous Owner | Fernandes Robert | $202,500 |
Source: Public Records
Tax History Compared to Growth
Tax History
| Year | Tax Paid | Tax Assessment Tax Assessment Total Assessment is a certain percentage of the fair market value that is determined by local assessors to be the total taxable value of land and additions on the property. | Land | Improvement |
|---|---|---|---|---|
| 2025 | $3,871 | $142,524 | $30,000 | $112,524 |
| 2024 | $3,871 | $142,524 | $30,000 | $112,524 |
| 2023 | $3,871 | $142,524 | $30,000 | $112,524 |
| 2022 | $3,566 | $130,344 | $20,000 | $110,344 |
| 2021 | $2,914 | $105,988 | $20,000 | $85,988 |
| 2020 | $2,303 | $83,768 | $14,400 | $69,368 |
| 2019 | $2,559 | $93,076 | $16,000 | $77,076 |
| 2018 | $2,559 | $93,076 | $16,000 | $77,076 |
| 2017 | $2,105 | $81,624 | $14,400 | $67,224 |
| 2016 | $1,935 | $75,020 | $14,400 | $60,620 |
| 2015 | $1,981 | $75,020 | $14,400 | $60,620 |
| 2014 | $1,773 | $66,532 | $0 | $0 |
Source: Public Records
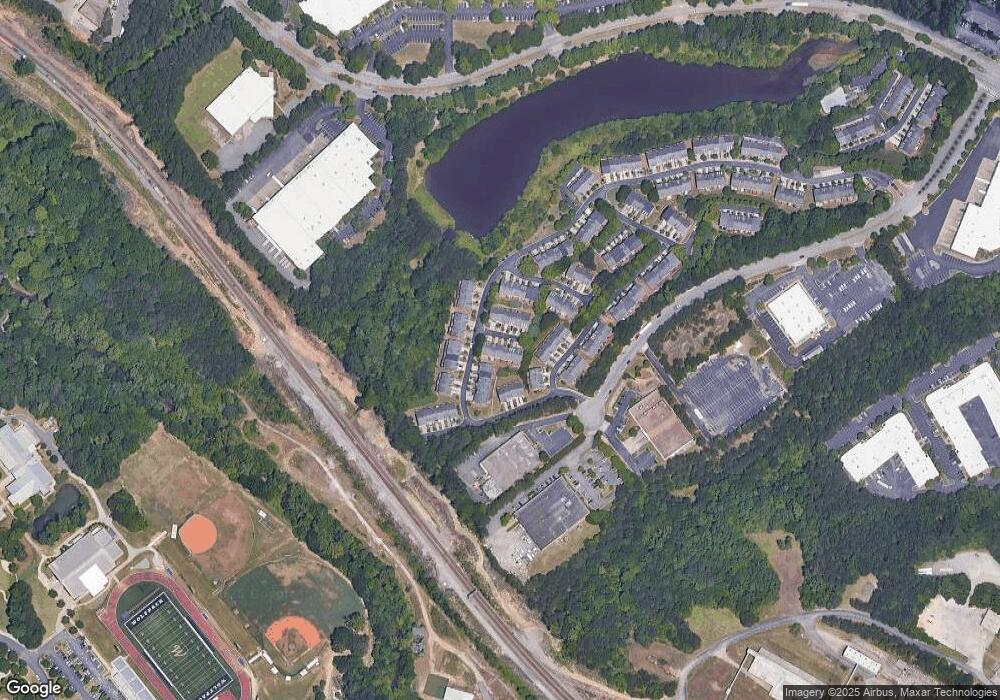
Map
Nearby Homes
- 1706 Highlands View SE Unit 17
- 1740 Highlands View SE Unit 11
- 1748 Highlands View SE Unit 10
- 1748 Highlands View Dr Unit BLDG 10
- 401 Iona Abbey Ct SE Unit 6
- 403 Iona Abbey Ct SE
- 0 Highlands Pkwy SE Unit 11594650
- 5022 Duxford Dr SE Unit 2
- 5013 Duxford Dr SE Unit 1
- 5066 Healey Dr
- 5055 Crowe Dr SE
- 5544 Nickajack Park Rd SE
- 4931 Durley Ln SE
- 1706 Durley Down Ct SE
- 5124 Parkwood Oaks Ln
- 1766 Fair Oak Way Unit 10
- 1961 Kenwood Rd SE
- 1255 Grand View Dr SE Unit 10
- 5491 Valley Brook Rd SE
- 4901 Prince Rd SE
- 204 MacLeans Cross Ln SE Unit 204
- 204 MacLeans Cross Ln SE Unit 16
- 204 MacLeans Cross Ln SE
- 208 MacLeans Cross Ln SE Unit 16
- 202 MacLeans Cross Ln SE Unit 16
- 202 MacLeans Cross Ln SE
- 210 MacLeans Cross Ln SE Unit 210
- 210 MacLeans Cross Ln SE Unit 16
- 210 MacLeans Cross Ln SE
- 1710 Highlands View SE
- 212 MacLeans Cross Ln SE Unit 212
- 212 MacLeans Cross Ln SE Unit 16
- 212 MacLeans Cross Ln SE
- 212 MacLeans Cross Ln SE
- 1708 Highlands View SE
- 1708 Highlands View Dr
- 1706 Highlands View Dr
- 1706 Highlands View SE
- 203 MacLeans Cross Ln SE Unit 15
- 203 MacLeans Cross Ln SE