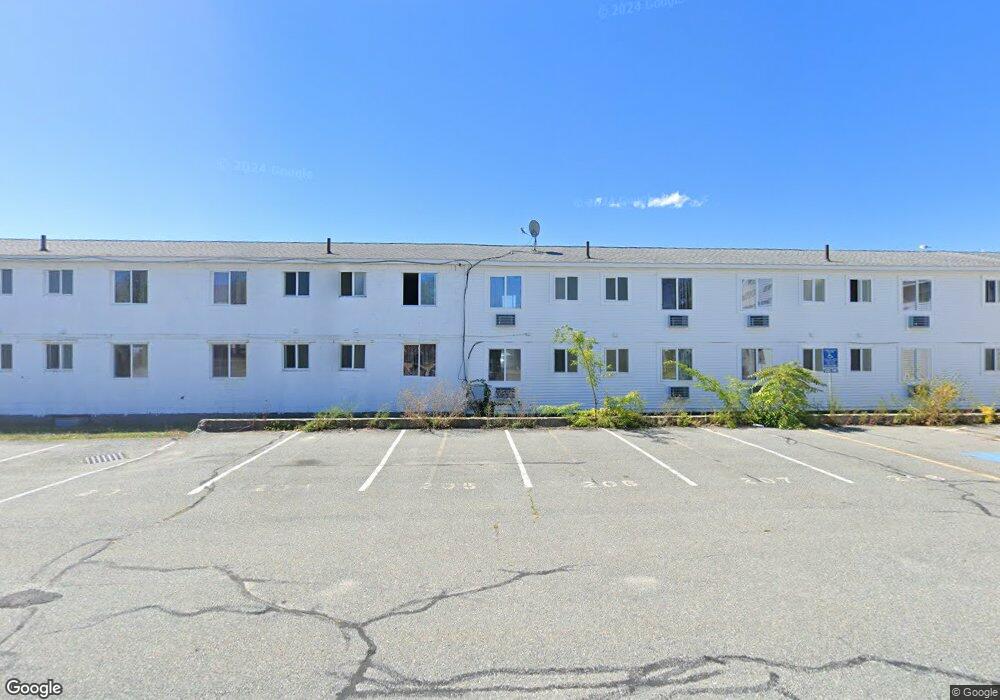
206 Main St Hyannis, MA 02601
Estimated Value: $4,019,259
Studio
--
Bath
--
Sq Ft
64,904
Sq Ft
About This Home
This home is located at 206 Main St, Hyannis, MA 02601 and is currently estimated at $4,019,259. 206 Main St is a home located in Barnstable County with nearby schools including Hyannis West Elementary School, Barnstable United Elementary School, and Barnstable Intermediate School.
Ownership History
Date
Name
Owned For
Owner Type
Purchase Details
Closed on
Jun 4, 2004
Sold by
C Squire Inc
Bought by
J & J Holdings Llc
Current Estimated Value
Home Financials for this Owner
Home Financials are based on the most recent Mortgage that was taken out on this home.
Original Mortgage
$1,800,000
Outstanding Balance
$876,365
Interest Rate
5.94%
Mortgage Type
Commercial
Estimated Equity
$3,142,894
Purchase Details
Closed on
Sep 1, 1995
Sold by
Molony Nelson C
Bought by
Smithson Diana L
Home Financials for this Owner
Home Financials are based on the most recent Mortgage that was taken out on this home.
Original Mortgage
$58,500
Interest Rate
7.61%
Mortgage Type
Commercial
Purchase Details
Closed on
Apr 27, 1995
Sold by
Hyannis County Squire
Bought by
C Squire Inc
Home Financials for this Owner
Home Financials are based on the most recent Mortgage that was taken out on this home.
Original Mortgage
$1,275,000
Interest Rate
8.33%
Mortgage Type
Commercial
Create a Home Valuation Report for This Property
The Home Valuation Report is an in-depth analysis detailing your home's value as well as a comparison with similar homes in the area
Home Values in the Area
Average Home Value in this Area
Purchase History
| Date | Buyer | Sale Price | Title Company |
|---|---|---|---|
| J & J Holdings Llc | $1,950,000 | -- | |
| Smithson Diana L | $65,000 | -- | |
| C Squire Inc | $1,449,000 | -- |
Source: Public Records
Mortgage History
| Date | Status | Borrower | Loan Amount |
|---|---|---|---|
| Open | J & J Holdings Llc | $1,800,000 | |
| Previous Owner | C Squire Inc | $850,000 | |
| Previous Owner | C Squire Inc | $1,050,000 | |
| Previous Owner | C Squire Inc | $58,500 | |
| Previous Owner | C Squire Inc | $1,275,000 |
Source: Public Records
Tax History
| Year | Tax Paid | Tax Assessment Tax Assessment Total Assessment is a certain percentage of the fair market value that is determined by local assessors to be the total taxable value of land and additions on the property. | Land | Improvement |
|---|---|---|---|---|
| 2025 | $35,764 | $4,504,500 | $614,600 | $3,889,900 |
| 2024 | $35,764 | $4,531,800 | $614,600 | $3,917,200 |
| 2023 | $0 | $4,531,800 | $614,600 | $3,917,200 |
| 2022 | $0 | $3,163,400 | $512,200 | $2,651,200 |
| 2021 | $0 | $3,163,400 | $512,200 | $2,651,200 |
| 2020 | $35,764 | $2,717,600 | $274,400 | $2,443,200 |
| 2019 | $36,688 | $2,717,600 | $274,400 | $2,443,200 |
| 2018 | $34,320 | $2,640,000 | $274,400 | $2,365,600 |
| 2017 | $33,211 | $2,640,000 | $274,400 | $2,365,600 |
| 2016 | $32,419 | $2,640,000 | $274,400 | $2,365,600 |
| 2015 | $27,491 | $2,290,900 | $263,600 | $2,027,300 |
Source: Public Records
Map
Nearby Homes
- 35 Pleasant St
- 68 Center St Unit 13
- 83 Main St
- 22 Terry Ct
- 115 School St Unit W206
- 110 School St Unit E113
- 55 Louis St
- 72 Grove St
- 287 Ocean St Unit C2
- 287 Ocean St Unit 2 BLDG C
- 97 Bassett Ln
- 25 Ripple Cove Rd
- 252 Hinckley Rd
- 23 Baxter Ave
- 138 Chase St
- 8 Jasmine Ln
- 78 Bristol Ave
- 49 Snow Creek Dr
- 18 Rachel Rd
- 125 Sea St
Your Personal Tour Guide
Ask me questions while you tour the home.