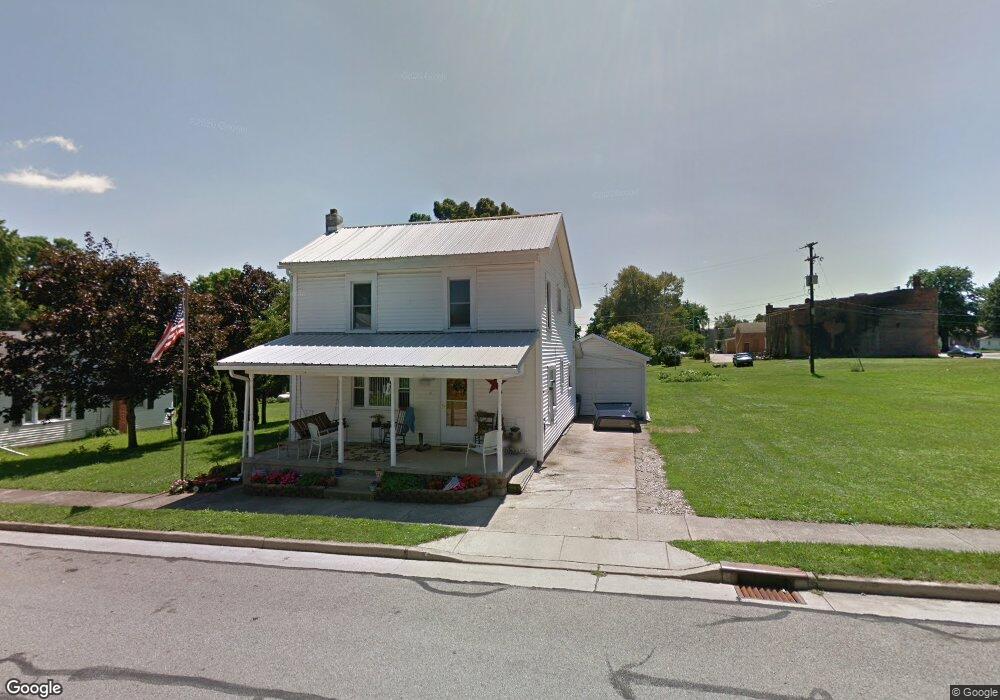
206 Main St Quincy, OH 43343
Estimated Value: $96,000 - $159,000
3
Beds
2
Baths
1,430
Sq Ft
$86/Sq Ft
Est. Value
About This Home
This home is located at 206 Main St, Quincy, OH 43343 and is currently estimated at $122,872, approximately $85 per square foot. 206 Main St is a home located in Logan County with nearby schools including Riverside Elementary School and Riverside High School.
Ownership History
Date
Name
Owned For
Owner Type
Purchase Details
Closed on
Dec 28, 2021
Sold by
Mees Jacob G and Lane Sarah
Bought by
Ritzma Justin
Current Estimated Value
Home Financials for this Owner
Home Financials are based on the most recent Mortgage that was taken out on this home.
Original Mortgage
$122,735
Outstanding Balance
$112,922
Interest Rate
2.98%
Mortgage Type
FHA
Estimated Equity
$9,950
Purchase Details
Closed on
May 26, 2017
Sold by
Kean Chad M and Kean Heather A
Bought by
Mees Jacob G and Lane Sarah
Home Financials for this Owner
Home Financials are based on the most recent Mortgage that was taken out on this home.
Original Mortgage
$86,406
Interest Rate
4.37%
Mortgage Type
FHA
Purchase Details
Closed on
Jan 26, 2007
Bought by
Kean Chad M
Purchase Details
Closed on
Nov 26, 2003
Bought by
Kean Chad M
Purchase Details
Closed on
Feb 28, 2003
Bought by
Hawkins Lacie J
Purchase Details
Closed on
May 8, 1997
Bought by
Elsea Ralph E
Create a Home Valuation Report for This Property
The Home Valuation Report is an in-depth analysis detailing your home's value as well as a comparison with similar homes in the area
Home Values in the Area
Average Home Value in this Area
Purchase History
| Date | Buyer | Sale Price | Title Company |
|---|---|---|---|
| Ritzma Justin | $125,000 | Mad River Title Agency | |
| Mees Jacob G | $88,000 | Chicago Title Company | |
| Kean Chad M | -- | -- | |
| Kean Chad M | $49,900 | -- | |
| Hawkins Lacie J | $52,000 | -- | |
| Elsea Ralph E | $59,500 | -- |
Source: Public Records
Mortgage History
| Date | Status | Borrower | Loan Amount |
|---|---|---|---|
| Open | Ritzma Justin | $122,735 | |
| Previous Owner | Mees Jacob G | $86,406 |
Source: Public Records
Tax History Compared to Growth
Tax History
| Year | Tax Paid | Tax Assessment Tax Assessment Total Assessment is a certain percentage of the fair market value that is determined by local assessors to be the total taxable value of land and additions on the property. | Land | Improvement |
|---|---|---|---|---|
| 2024 | $759 | $23,440 | $3,820 | $19,620 |
| 2023 | $759 | $23,440 | $3,820 | $19,620 |
| 2022 | $759 | $19,550 | $3,190 | $16,360 |
| 2021 | $667 | $19,550 | $3,190 | $16,360 |
| 2020 | $686 | $16,410 | $3,060 | $13,350 |
| 2019 | $685 | $16,410 | $3,060 | $13,350 |
| 2018 | $578 | $16,410 | $3,060 | $13,350 |
| 2016 | $606 | $18,230 | $3,400 | $14,830 |
| 2014 | $639 | $18,230 | $3,400 | $14,830 |
| 2013 | $635 | $18,230 | $3,400 | $14,830 |
| 2012 | $890 | $21,920 | $3,400 | $18,520 |
Source: Public Records
Map
Nearby Homes
- 327 S Miami St
- 116 N Mill St
- 103 N Boggs St
- 203 N Koke St
- 380 S Main St
- 341 S Main St
- 21242 Dingman Slagle Rd
- 9351 Crowl Rd
- 22555 Lefever Rd
- 8154 Crowl Rd
- 5114 Dormire Rd
- 10879 Archer St
- 0 Dingman-Slagle Rd Unit 1856661
- 0 Dingman-Slagle Rd Unit 225034870
- 0 Dingman-Slagle Rd Unit 1039895
- 18333 Herring Rd
- 8116 Township Road 207
- 18255 Pence Rd