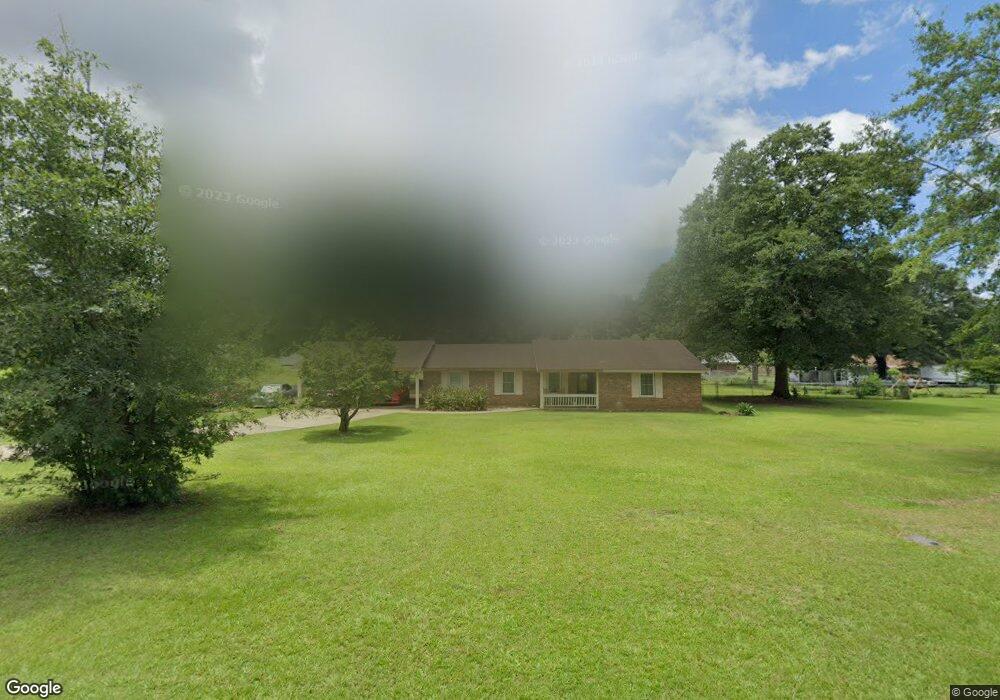
206 Maple St Americus, GA 31719
Estimated Value: $134,000 - $195,000
3
Beds
2
Baths
1,556
Sq Ft
$104/Sq Ft
Est. Value
About This Home
This home is located at 206 Maple St, Americus, GA 31719 and is currently estimated at $162,155, approximately $104 per square foot. 206 Maple St is a home located in Sumter County with nearby schools including Sumter County Primary School, Sumter County Elementary School, and Sumter County Middle School.
Ownership History
Date
Name
Owned For
Owner Type
Purchase Details
Closed on
Jul 20, 2006
Sold by
Pless Tommy L
Bought by
Wright Twanna T
Current Estimated Value
Home Financials for this Owner
Home Financials are based on the most recent Mortgage that was taken out on this home.
Original Mortgage
$108,000
Outstanding Balance
$62,860
Interest Rate
6.68%
Mortgage Type
New Conventional
Estimated Equity
$99,295
Purchase Details
Closed on
Oct 29, 2002
Sold by
Pless Tommy
Bought by
Pless Tommy
Purchase Details
Closed on
Feb 10, 1998
Sold by
Doggett James L
Bought by
Mellott James A and Mellott A
Purchase Details
Closed on
Mar 25, 1994
Sold by
Newton Garry L
Bought by
Doggett James L
Purchase Details
Closed on
Apr 22, 1992
Sold by
Terry Rraymond D
Bought by
Newton Garry L
Purchase Details
Closed on
Jul 19, 1991
Sold by
Newton Garry L
Bought by
Terry Rraymond D
Purchase Details
Closed on
Sep 20, 1989
Bought by
Newton Garry L
Create a Home Valuation Report for This Property
The Home Valuation Report is an in-depth analysis detailing your home's value as well as a comparison with similar homes in the area
Purchase History
| Date | Buyer | Sale Price | Title Company |
|---|---|---|---|
| Wright Twanna T | $108,000 | -- | |
| Pless Tommy | -- | -- | |
| Pless Tommy | $81,100 | -- | |
| Mellott James A | $68,000 | -- | |
| Doggett James L | $61,000 | -- | |
| Newton Garry L | $57,100 | -- | |
| Terry Rraymond D | $59,700 | -- | |
| Newton Garry L | $57,500 | -- |
Source: Public Records
Mortgage History
| Date | Status | Borrower | Loan Amount |
|---|---|---|---|
| Open | Wright Twanna T | $108,000 |
Source: Public Records
Tax History
| Year | Tax Paid | Tax Assessment Tax Assessment Total Assessment is a certain percentage of the fair market value that is determined by local assessors to be the total taxable value of land and additions on the property. | Land | Improvement |
|---|---|---|---|---|
| 2025 | $1,462 | $33,800 | $3,200 | $30,600 |
| 2024 | $1,462 | $33,800 | $3,200 | $30,600 |
| 2023 | $1,431 | $33,800 | $3,200 | $30,600 |
| 2022 | $961 | $33,800 | $3,200 | $30,600 |
| 2021 | $1,433 | $33,800 | $3,200 | $30,600 |
| 2020 | $1,467 | $33,800 | $3,200 | $30,600 |
| 2019 | $1,554 | $33,800 | $3,200 | $30,600 |
| 2018 | $1,000 | $33,800 | $3,200 | $30,600 |
| 2017 | $1,000 | $33,800 | $3,200 | $30,600 |
| 2016 | $1,431 | $33,800 | $3,200 | $30,600 |
| 2015 | $1,088 | $37,560 | $3,200 | $34,360 |
| 2014 | $1,091 | $37,560 | $3,200 | $34,360 |
| 2013 | -- | $37,560 | $3,200 | $34,360 |
Source: Public Records
Map
Nearby Homes
- 1708 Armory Dr
- 207 Eckles Rd
- 310 Tabby Ln
- 914 Adderton St
- 402 Rawley Rd
- 107 Glory Ct
- 420 Rawley Rd
- 428 Rawley Rd
- 166 Lakeshore Dr
- 213 Mitchell St
- 1226 S Ga Tech Pkwy
- 100 Odum Rd
- 130 Mallard Ln
- 205 U S 19
- 000 U S Highway 19
- 215 Mockingbird Dr
- 604 A-C Ga Hwy 49s
- 253 Ga Hwy 27e
- 909 Hwy E Ga Hwy 27e
- 333 Academy St
Your Personal Tour Guide
Ask me questions while you tour the home.