Estimated Value: $436,000 - $471,000
5
Beds
3
Baths
1,996
Sq Ft
$223/Sq Ft
Est. Value
About This Home
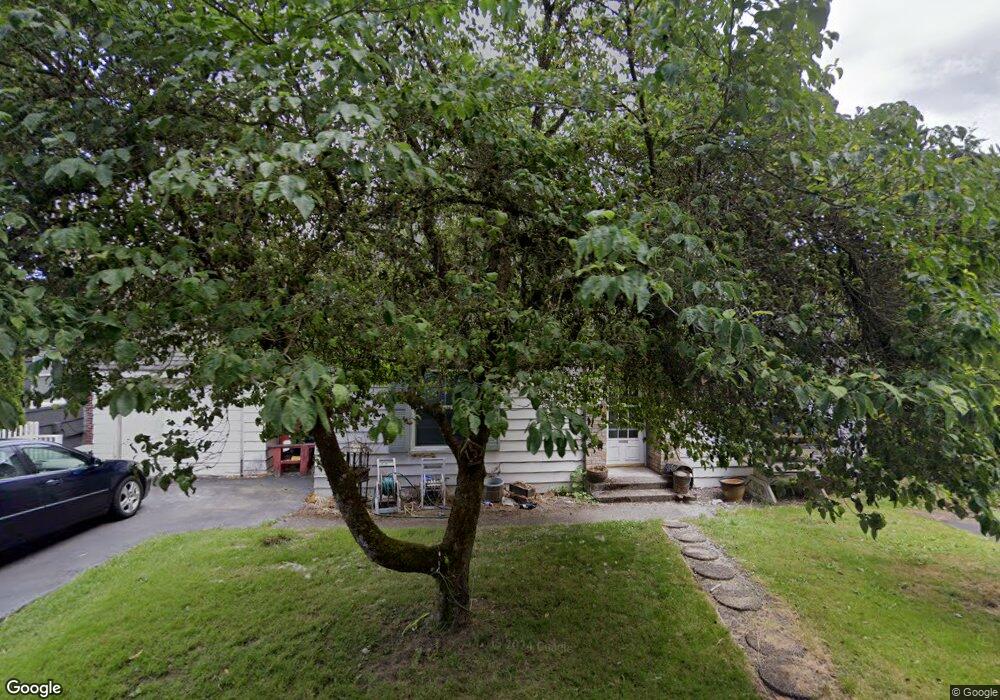
This home is located at 206 N 9th Ave, Kelso, WA 98626 and is currently estimated at $445,320, approximately $223 per square foot. 206 N 9th Ave is a home located in Cowlitz County with nearby schools including Catlin Elementary School, Huntington Middle School, and Kelso High School.
Ownership History
Date
Name
Owned For
Owner Type
Purchase Details
Closed on
Mar 14, 2017
Sold by
Harris Floyd and Harris Valerie
Bought by
Harris Valerie
Current Estimated Value
Purchase Details
Closed on
Oct 15, 2014
Sold by
Miller Jeffrey W and Miller Becky
Bought by
Harris Floyd and Harris Valerie
Home Financials for this Owner
Home Financials are based on the most recent Mortgage that was taken out on this home.
Original Mortgage
$179,262
Outstanding Balance
$137,329
Interest Rate
4.08%
Mortgage Type
VA
Estimated Equity
$307,991
Create a Home Valuation Report for This Property
The Home Valuation Report is an in-depth analysis detailing your home's value as well as a comparison with similar homes in the area
Home Values in the Area
Average Home Value in this Area
Purchase History
| Date | Buyer | Sale Price | Title Company |
|---|---|---|---|
| Harris Valerie | -- | None Available | |
| Harris Floyd | $173,145 | Cowlitz County Title Company |
Source: Public Records
Mortgage History
| Date | Status | Borrower | Loan Amount |
|---|---|---|---|
| Open | Harris Floyd | $179,262 |
Source: Public Records
Tax History Compared to Growth
Tax History
| Year | Tax Paid | Tax Assessment Tax Assessment Total Assessment is a certain percentage of the fair market value that is determined by local assessors to be the total taxable value of land and additions on the property. | Land | Improvement |
|---|---|---|---|---|
| 2024 | $3,336 | $338,390 | $50,530 | $287,860 |
| 2023 | $3,688 | $380,210 | $48,130 | $332,080 |
| 2022 | $3,417 | $359,600 | $48,130 | $311,470 |
| 2021 | $3,505 | $322,960 | $46,780 | $276,180 |
| 2020 | $3,064 | $296,400 | $40,680 | $255,720 |
| 2019 | $2,885 | $259,242 | $40,677 | $218,565 |
| 2018 | $2,688 | $234,100 | $40,680 | $193,420 |
| 2017 | $2,528 | $198,480 | $38,740 | $159,740 |
| 2016 | $2,203 | $187,140 | $38,740 | $148,400 |
| 2015 | $2,284 | $162,050 | $38,860 | $123,190 |
| 2013 | -- | $156,610 | $37,010 | $119,600 |
Source: Public Records
Map
Nearby Homes