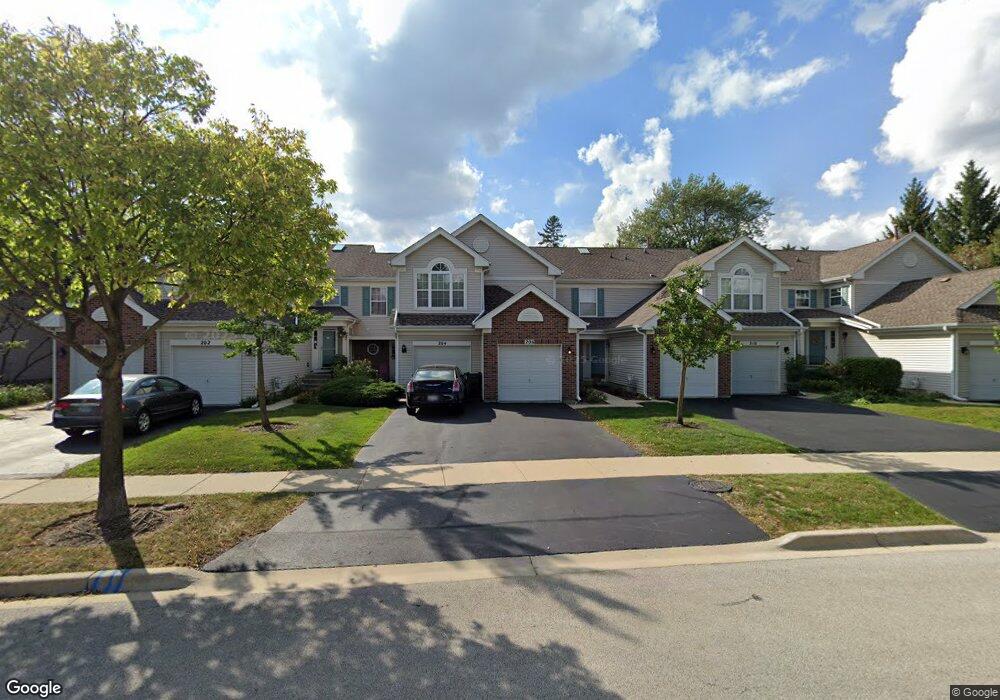
206 N Cathy Ln Mount Prospect, IL 60056
Downtown Mount Prospect NeighborhoodEstimated Value: $312,000 - $326,463
2
Beds
--
Bath
1,350
Sq Ft
$234/Sq Ft
Est. Value
About This Home
This home is located at 206 N Cathy Ln, Mount Prospect, IL 60056 and is currently estimated at $315,866, approximately $233 per square foot. 206 N Cathy Ln is a home located in Cook County with nearby schools including Fairview Elementary School, Lincoln Middle School, and Prospect High School.
Ownership History
Date
Name
Owned For
Owner Type
Purchase Details
Closed on
Dec 30, 2024
Sold by
Meyer Rosemarie
Bought by
Erkus Sahin
Current Estimated Value
Home Financials for this Owner
Home Financials are based on the most recent Mortgage that was taken out on this home.
Original Mortgage
$281,200
Outstanding Balance
$279,537
Interest Rate
7.63%
Mortgage Type
New Conventional
Estimated Equity
$36,329
Purchase Details
Closed on
Oct 20, 1998
Sold by
Stedman Steven E and Stedman Susan C
Bought by
Meyer Rosemarie
Home Financials for this Owner
Home Financials are based on the most recent Mortgage that was taken out on this home.
Original Mortgage
$156,000
Interest Rate
6.88%
Purchase Details
Closed on
May 26, 1995
Sold by
Stedman Steven E and Stedman Susan C
Bought by
Stedman Steven E and Stedman Susan C
Purchase Details
Closed on
Feb 23, 1994
Sold by
Millers Station Mt Prospect Ltd Prtnrshp
Bought by
Stedman Steven E and Stedman Susan C
Home Financials for this Owner
Home Financials are based on the most recent Mortgage that was taken out on this home.
Original Mortgage
$129,000
Interest Rate
7.05%
Create a Home Valuation Report for This Property
The Home Valuation Report is an in-depth analysis detailing your home's value as well as a comparison with similar homes in the area
Home Values in the Area
Average Home Value in this Area
Purchase History
| Date | Buyer | Sale Price | Title Company |
|---|---|---|---|
| Erkus Sahin | $296,000 | Citywide Title | |
| Meyer Rosemarie | $166,000 | Mercury Title Company | |
| Stedman Steven E | -- | -- | |
| Stedman Steven E | $104,333 | -- |
Source: Public Records
Mortgage History
| Date | Status | Borrower | Loan Amount |
|---|---|---|---|
| Open | Erkus Sahin | $281,200 | |
| Previous Owner | Meyer Rosemarie | $156,000 | |
| Previous Owner | Stedman Steven E | $129,000 |
Source: Public Records
Tax History Compared to Growth
Tax History
| Year | Tax Paid | Tax Assessment Tax Assessment Total Assessment is a certain percentage of the fair market value that is determined by local assessors to be the total taxable value of land and additions on the property. | Land | Improvement |
|---|---|---|---|---|
| 2024 | $5,306 | $22,401 | $4,205 | $18,196 |
| 2023 | $5,074 | $22,401 | $4,205 | $18,196 |
| 2022 | $5,074 | $22,401 | $4,205 | $18,196 |
| 2021 | $5,142 | $19,864 | $438 | $19,426 |
| 2020 | $5,104 | $19,864 | $438 | $19,426 |
| 2019 | $5,106 | $22,087 | $438 | $21,649 |
| 2018 | $4,430 | $17,954 | $350 | $17,604 |
| 2017 | $4,460 | $17,954 | $350 | $17,604 |
| 2016 | $4,092 | $17,954 | $350 | $17,604 |
| 2015 | $4,339 | $17,590 | $2,277 | $15,313 |
| 2014 | $4,280 | $17,590 | $2,277 | $15,313 |
| 2013 | $4,261 | $17,590 | $2,277 | $15,313 |
Source: Public Records
Map
Nearby Homes
- 1255 W Prospect Ave Unit 208
- 701 W Central Rd Unit B3
- 1326 W Central Rd
- 613 W Central Rd Unit B7
- 203 S See Gwun Ave
- 7 N Elmhurst Ave
- 315 S We go Trail
- 428 S Phelps Ave
- 512 N Prospect Manor Ave
- 1615 E Central Rd Unit 417C
- 5 S Pine St Unit 507B
- 5 S Pine St Unit 302B
- 314 N Pine St
- 10 S Wille St Unit 603
- 1703 Bonita Ave
- 415 N Russel St
- 5 W Central Rd Unit 410
- 20 S Main St Unit 312
- 1505 E Central Rd Unit 303A
- 1405 E Central Rd Unit 122C
- 208 N Cathy Ln Unit 25
- 204 N Cathy Ln Unit 23
- 210 N Cathy Ln Unit 26
- 202 N Cathy Ln Unit 22
- 202 N Cathy Ln Unit 202
- 212 N Cathy Ln Unit 27
- 200 N Cathy Ln Unit 21
- 214 N Cathy Ln Unit 28
- 218 N Cathy Ln Unit 31
- 32 Millers Ln Unit 16
- 105 N Lancaster St
- 30 Millers Ln Unit 15
- 107 N Lancaster St
- 220 N Cathy Ln Unit 32
- 103 N Lancaster St
- 28 Millers Ln Unit 14
- 222 N Cathy Ln Unit 33
- 26 Millers Ln Unit 13
- 224 N Cathy Ln Unit 34
- 101 N Lancaster St