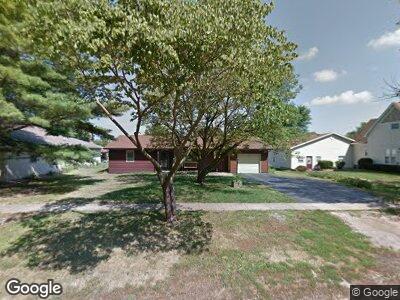
206 N Locust St Wapella, IL 61777
Estimated Value: $114,000 - $151,000
--
Bed
--
Bath
1,360
Sq Ft
$96/Sq Ft
Est. Value
About This Home
This home is located at 206 N Locust St, Wapella, IL 61777 and is currently estimated at $130,474, approximately $95 per square foot. 206 N Locust St is a home with nearby schools including Clinton High School.
Ownership History
Date
Name
Owned For
Owner Type
Purchase Details
Closed on
Sep 27, 2021
Sold by
Ellis Austin A and Ellis Bree
Bought by
West Tera A
Current Estimated Value
Home Financials for this Owner
Home Financials are based on the most recent Mortgage that was taken out on this home.
Original Mortgage
$107,025
Outstanding Balance
$100,116
Interest Rate
3%
Mortgage Type
FHA
Purchase Details
Closed on
Dec 15, 2014
Sold by
Fitzgerald Susan D
Bought by
Ellis Austin A
Home Financials for this Owner
Home Financials are based on the most recent Mortgage that was taken out on this home.
Original Mortgage
$57,300
Interest Rate
3.75%
Mortgage Type
New Conventional
Purchase Details
Closed on
Oct 27, 2014
Sold by
Susan D Susan D and Harris Tomas B
Bought by
Fitzgerald Susan D and Harris Thomas B
Home Financials for this Owner
Home Financials are based on the most recent Mortgage that was taken out on this home.
Original Mortgage
$57,300
Interest Rate
3.75%
Mortgage Type
New Conventional
Create a Home Valuation Report for This Property
The Home Valuation Report is an in-depth analysis detailing your home's value as well as a comparison with similar homes in the area
Home Values in the Area
Average Home Value in this Area
Purchase History
| Date | Buyer | Sale Price | Title Company |
|---|---|---|---|
| West Tera A | $109,000 | None Available | |
| Ellis Austin A | $62,500 | -- | |
| Fitzgerald Susan D | -- | -- |
Source: Public Records
Mortgage History
| Date | Status | Borrower | Loan Amount |
|---|---|---|---|
| Open | West Tera A | $107,025 | |
| Previous Owner | Ellis Austin A | $57,300 |
Source: Public Records
Tax History Compared to Growth
Tax History
| Year | Tax Paid | Tax Assessment Tax Assessment Total Assessment is a certain percentage of the fair market value that is determined by local assessors to be the total taxable value of land and additions on the property. | Land | Improvement |
|---|---|---|---|---|
| 2024 | $2,140 | $40,241 | $3,661 | $36,580 |
| 2023 | $2,140 | $36,649 | $3,334 | $33,315 |
| 2022 | $2,003 | $34,574 | $3,145 | $31,429 |
| 2021 | $1,882 | $33,567 | $3,053 | $30,514 |
| 2020 | $1,941 | $33,567 | $3,053 | $30,514 |
| 2019 | $1,957 | $33,567 | $3,053 | $30,514 |
| 2018 | $1,890 | $32,780 | $2,981 | $29,799 |
| 2017 | $1,853 | $31,938 | $2,866 | $29,072 |
| 2016 | $1,831 | $31,312 | $2,810 | $28,502 |
| 2015 | $1,449 | $31,312 | $2,810 | $28,502 |
| 2014 | $1,449 | $31,312 | $2,810 | $28,502 |
| 2013 | -- | $31,312 | $2,810 | $28,502 |
Source: Public Records
Map
Nearby Homes
- 400 S 2nd St E
- 100 S 4th St
- 6200 Carl Springs Rd
- 8401 Idlewood Rd
- 0 N Cain St
- 800 E Webster St
- 607 N Moore St
- 518 N Jackson St
- 416 W Macon St
- 321 N Mulberry St
- 310 N Mulberry St
- 301 N Madison St
- 1408 E Washington St
- 1619 E Washington St
- 212 E Jefferson St
- 1106 E Jefferson St
- 1104 E Jefferson St
- 313 S Cain St
- 1500 E Jefferson St
- 120 E Van Buren St
- 206 N Locust St
- 200 N Locust St
- 212 N Locust St
- 216 N Locust St
- 211 N Locust St
- 215 N Locust St
- 209 N Poplar Rd
- 120 N Locust St
- 205 N Poplar St
- 221 N Locust St
- 416 N 1st St
- 201 N Locust St
- 121 N Locust St
- 411 N 2nd St
- 225 N Locust St
- 409 N 1st St
- 116 N Locust St
- 215 N Poplar St
- 107 N Poplar St
- 115 N Locust St