Estimated Value: $258,670 - $340,000
3
Beds
2
Baths
1,309
Sq Ft
$221/Sq Ft
Est. Value
About This Home
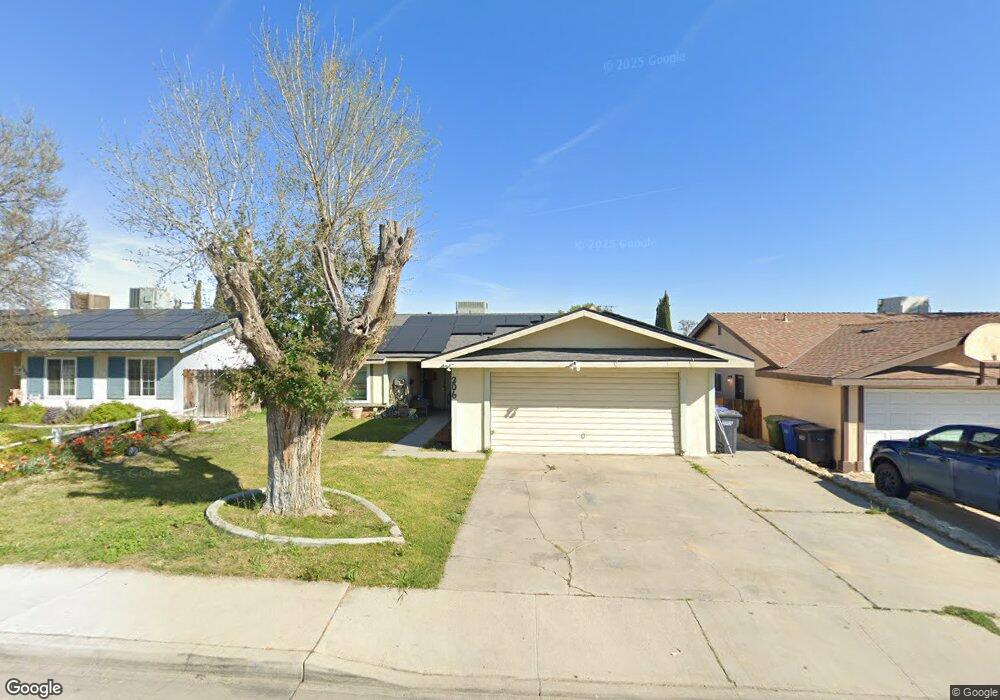
This home is located at 206 Pilgrim Ave, Taft, CA 93268 and is currently estimated at $289,918, approximately $221 per square foot. 206 Pilgrim Ave is a home located in Kern County with nearby schools including Parkview Elementary School, Roosevelt Elementary School, and Lincoln Junior High School.
Ownership History
Date
Name
Owned For
Owner Type
Purchase Details
Closed on
Jun 18, 2021
Sold by
Mellor John Lawrence and Zander Joshua Alan
Bought by
Peterson Douglas C
Current Estimated Value
Home Financials for this Owner
Home Financials are based on the most recent Mortgage that was taken out on this home.
Original Mortgage
$152,000
Outstanding Balance
$137,617
Interest Rate
2.9%
Mortgage Type
New Conventional
Estimated Equity
$152,301
Purchase Details
Closed on
May 11, 1999
Sold by
Anderson Fred L and Anderson Karen D
Bought by
Zander G Mark and Zander Vienna Jean
Home Financials for this Owner
Home Financials are based on the most recent Mortgage that was taken out on this home.
Original Mortgage
$89,861
Interest Rate
7.01%
Mortgage Type
FHA
Purchase Details
Closed on
Nov 13, 1998
Sold by
Anderson Fred L and Anderson Karen D
Bought by
Anderson Fred L and Anderson Karen D
Create a Home Valuation Report for This Property
The Home Valuation Report is an in-depth analysis detailing your home's value as well as a comparison with similar homes in the area
Home Values in the Area
Average Home Value in this Area
Purchase History
| Date | Buyer | Sale Price | Title Company |
|---|---|---|---|
| Peterson Douglas C | $160,000 | Lennar Title Inc | |
| Zander G Mark | $90,000 | Fidelity National Title Co | |
| Anderson Fred L | -- | -- |
Source: Public Records
Mortgage History
| Date | Status | Borrower | Loan Amount |
|---|---|---|---|
| Open | Peterson Douglas C | $152,000 | |
| Previous Owner | Zander G Mark | $89,861 | |
| Closed | Zander G Mark | $4,500 |
Source: Public Records
Tax History
| Year | Tax Paid | Tax Assessment Tax Assessment Total Assessment is a certain percentage of the fair market value that is determined by local assessors to be the total taxable value of land and additions on the property. | Land | Improvement |
|---|---|---|---|---|
| 2025 | $3,659 | $204,812 | $31,836 | $172,976 |
| 2024 | $3,422 | $200,797 | $31,212 | $169,585 |
| 2023 | $3,422 | $196,860 | $30,600 | $166,260 |
| 2022 | $3,275 | $193,000 | $30,000 | $163,000 |
| 2021 | $2,427 | $126,520 | $26,852 | $99,668 |
| 2020 | $2,387 | $125,224 | $26,577 | $98,647 |
| 2019 | $2,163 | $125,224 | $26,577 | $98,647 |
| 2018 | $2,127 | $120,363 | $25,546 | $94,817 |
| 2017 | $2,072 | $118,004 | $25,046 | $92,958 |
| 2016 | $2,123 | $115,691 | $24,555 | $91,136 |
| 2015 | $1,953 | $117,386 | $26,082 | $91,304 |
| 2014 | $1,880 | $115,088 | $25,572 | $89,516 |
Source: Public Records
Map
Nearby Homes
- 204 Pilgrim Ave
- 208 Pilgrim Ave
- 300 Pilgrim Ave
- 202 Pilgrim Ave
- 207 Sunset Ln
- 100 Lexington Ave
- 123 N 10th St Unit 75
- 123 N 10th St Unit 47
- 123 N 10th St Unit 110
- 123 N 10th St Unit 19
- 123 N 10th St Unit 79
- 123 N 10th St Unit 45
- 123 N 10th St Unit 46
- 123 N 10th St Unit 55
- 123 N 10th St Unit 63
- 123 N 10th St Unit 48
- 123 N 10th St Unit 6
- 123 N 10th St Unit 43
- 123 N 10th St Unit 113
- 123 N 10th St Unit 31
Your Personal Tour Guide
Ask me questions while you tour the home.