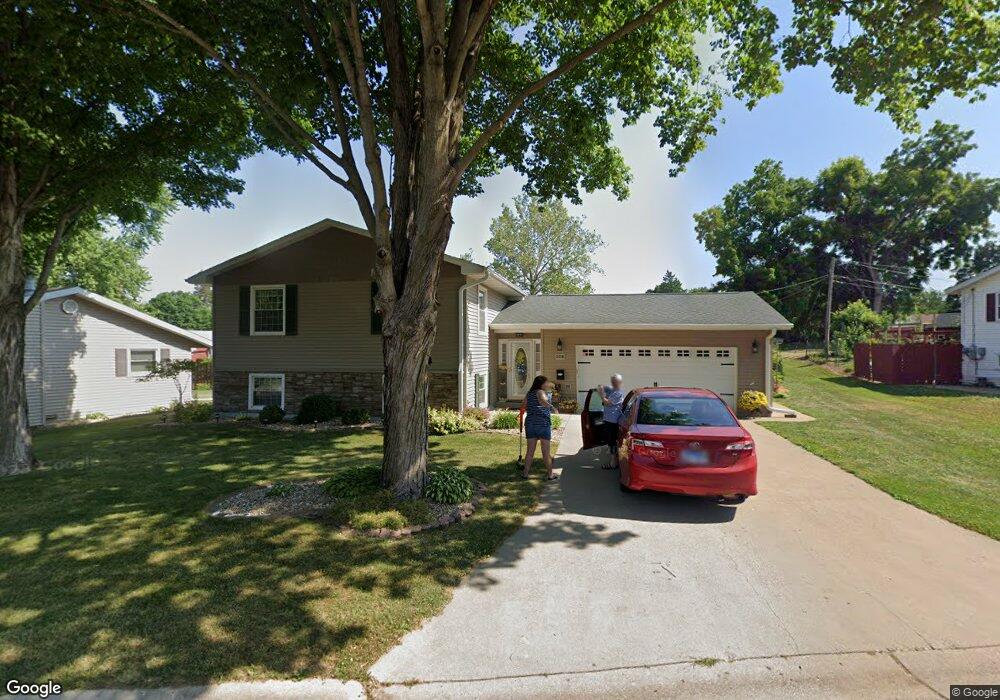
206 Pine St Morrison, IL 61270
Estimated Value: $140,601 - $161,000
Studio
--
Bath
--
Sq Ft
7,710
Sq Ft Lot
About This Home
This home is located at 206 Pine St, Morrison, IL 61270 and is currently estimated at $152,400. 206 Pine St is a home located in Whiteside County with nearby schools including Northside School, Southside School, and Morrison Junior High School.
Ownership History
Date
Name
Owned For
Owner Type
Purchase Details
Closed on
Jan 28, 2011
Sold by
Lane Allan
Bought by
Clemens Kevin L and Clemens Maribeth
Current Estimated Value
Home Financials for this Owner
Home Financials are based on the most recent Mortgage that was taken out on this home.
Original Mortgage
$55,000
Outstanding Balance
$37,707
Interest Rate
4.82%
Mortgage Type
New Conventional
Estimated Equity
$114,693
Purchase Details
Closed on
Jan 9, 2008
Sold by
Schmidt Kristopher Steven and Schmidt Sarah E
Bought by
Lane Donald L and Lane Joan M
Purchase Details
Closed on
May 16, 2005
Sold by
Schmidt Shawnelle Rene
Bought by
Schmidt Kristopher Steven
Create a Home Valuation Report for This Property
The Home Valuation Report is an in-depth analysis detailing your home's value as well as a comparison with similar homes in the area
Home Values in the Area
Average Home Value in this Area
Purchase History
| Date | Buyer | Sale Price | Title Company |
|---|---|---|---|
| Clemens Kevin L | $125,000 | None Available | |
| Lane Donald L | $132,000 | None Available | |
| Schmidt Kristopher Steven | -- | None Available |
Source: Public Records
Mortgage History
| Date | Status | Borrower | Loan Amount |
|---|---|---|---|
| Open | Clemens Kevin L | $55,000 |
Source: Public Records
Tax History
| Year | Tax Paid | Tax Assessment Tax Assessment Total Assessment is a certain percentage of the fair market value that is determined by local assessors to be the total taxable value of land and additions on the property. | Land | Improvement |
|---|---|---|---|---|
| 2024 | $2,915 | $48,733 | $2,261 | $46,472 |
| 2023 | $3,037 | $44,367 | $2,058 | $42,309 |
| 2022 | $2,805 | $41,202 | $1,911 | $39,291 |
| 2021 | $2,718 | $40,346 | $1,871 | $38,475 |
| 2020 | $2,781 | $41,110 | $1,906 | $39,204 |
| 2019 | $2,933 | $42,566 | $1,974 | $40,592 |
| 2018 | $3,324 | $42,375 | $1,965 | $40,410 |
| 2017 | $3,067 | $41,835 | $3,017 | $38,818 |
| 2016 | $2,928 | $40,350 | $2,910 | $37,440 |
| 2015 | $277 | $37,748 | $2,982 | $34,766 |
| 2014 | $2,745 | $37,321 | $2,948 | $34,373 |
| 2013 | $277 | $37,748 | $2,982 | $34,766 |
Source: Public Records
Map
Nearby Homes
- 215 Cedar St
- 418 E Wall St
- 513 E Main St
- 102 S Jackson St
- 503 E Main St
- 403 E Park St
- 101 N Jackson St
- 503 Portland Ave
- 302 E Park St
- 400 E Knox St
- 109 E Morris St
- 509 S Madison St
- 308 S Genesee St
- 406 S Genesee St
- 301 S Genesee St
- 507 Jenkran St Unit 4
- 105 E Knox St
- 00 N Jackson St
- 208 Johnson St
- 523 Barden St
Your Personal Tour Guide
Ask me questions while you tour the home.