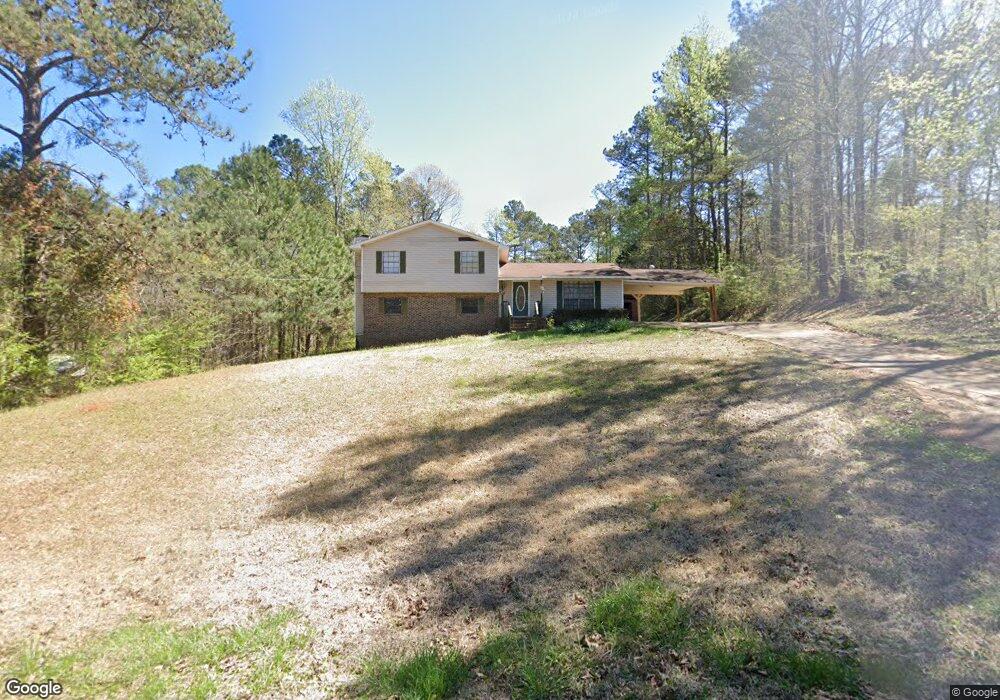
206 Pinehaven Dr Lagrange, GA 30240
Estimated Value: $246,000 - $268,000
3
Beds
3
Baths
2,004
Sq Ft
$127/Sq Ft
Est. Value
About This Home
This home is located at 206 Pinehaven Dr, Lagrange, GA 30240 and is currently estimated at $255,244, approximately $127 per square foot. 206 Pinehaven Dr is a home located in Troup County with nearby schools including Ethel W. Kight Elementary School, Hollis Hand Elementary School, and Franklin Forest Elementary School.
Ownership History
Date
Name
Owned For
Owner Type
Purchase Details
Closed on
Jan 7, 2020
Sold by
Davis Deborah Abernathy
Bought by
Davis Jeffrey S
Current Estimated Value
Purchase Details
Closed on
Jan 6, 2020
Sold by
Abernathy Leola
Bought by
Davis Deborah Abernathy and Henderson Emily Dale
Purchase Details
Closed on
Jul 17, 2001
Sold by
John J Mckinstry
Bought by
Davis Jeffery S
Purchase Details
Closed on
Feb 23, 2000
Sold by
Douglas Danny M and Douglas Linda K
Bought by
John J Mckinstry
Purchase Details
Closed on
Aug 17, 1989
Sold by
Edward L Thompson
Bought by
Douglas Danny M and Douglas Linda K
Purchase Details
Closed on
Nov 1, 1986
Sold by
Doris B Almand
Bought by
Edward L Thompson
Purchase Details
Closed on
Sep 19, 1978
Sold by
James H Beard
Bought by
Doris B Almand
Purchase Details
Closed on
May 2, 1978
Sold by
Charles Palmer and Woody Pierce
Bought by
James H Beard
Purchase Details
Closed on
Aug 11, 1977
Sold by
B K Prop
Bought by
Charles Palmer and Woody Pierce
Purchase Details
Closed on
Oct 21, 1976
Bought by
B K Prop
Create a Home Valuation Report for This Property
The Home Valuation Report is an in-depth analysis detailing your home's value as well as a comparison with similar homes in the area
Home Values in the Area
Average Home Value in this Area
Purchase History
| Date | Buyer | Sale Price | Title Company |
|---|---|---|---|
| Davis Jeffrey S | -- | -- | |
| Davis Deborah Abernathy | -- | -- | |
| Davis Jeffery S | $121,500 | -- | |
| John J Mckinstry | $101,000 | -- | |
| Douglas Danny M | $65,000 | -- | |
| Edward L Thompson | -- | -- | |
| Doris B Almand | $45,000 | -- | |
| James H Beard | -- | -- | |
| Charles Palmer | -- | -- | |
| B K Prop | -- | -- |
Source: Public Records
Tax History Compared to Growth
Tax History
| Year | Tax Paid | Tax Assessment Tax Assessment Total Assessment is a certain percentage of the fair market value that is determined by local assessors to be the total taxable value of land and additions on the property. | Land | Improvement |
|---|---|---|---|---|
| 2024 | $1,772 | $66,972 | $10,000 | $56,972 |
| 2023 | $1,213 | $64,384 | $10,000 | $54,384 |
| 2022 | $1,691 | $62,584 | $10,000 | $52,584 |
| 2021 | $1,114 | $38,940 | $6,000 | $32,940 |
| 2020 | $1,114 | $38,940 | $6,000 | $32,940 |
| 2019 | $1,033 | $36,248 | $6,000 | $30,248 |
| 2018 | $1,033 | $36,248 | $6,000 | $30,248 |
| 2017 | $1,033 | $36,248 | $6,000 | $30,248 |
| 2016 | $977 | $34,393 | $6,000 | $28,393 |
| 2015 | $979 | $34,393 | $6,000 | $28,393 |
| 2014 | $936 | $32,898 | $6,000 | $26,898 |
| 2013 | -- | $34,086 | $6,000 | $28,086 |
Source: Public Records
Map
Nearby Homes
- 223 Pinehaven Dr
- 117 Brookwood Dr
- 146 Whitaker Rd
- 104 Spring Valley Dr
- 641 Whitaker Rd
- 200 Cheyenne Dr
- 141 Avery Dr
- 208 Highland Trail
- 0 Unit 10514554
- 37 Overbrook Dr
- E Angela Dr
- LOT 4 Angela Dr
- 212 Aster Way
- 509 Connie Dr
- 243 Oak Dr
- 0 Bradfield Dr Unit 10568803
- 654 Cameron Mill Rd
- 190 Hill Rd
- 101 Deal Dr
- 808 S Fling Rd
- 0 Pinehaven Dr Unit 8615534
- 0 Pinehaven Dr Unit 8445920
- 0 Pinehaven Dr Unit 9049658
- 0 Pinehaven Dr Unit 8766452
- 0 Pinehaven Dr Unit 3072604
- 0 Pinehaven Dr Unit 7115317
- 0 Pinehaven Dr Unit 7457749
- 0 Pinehaven Dr Unit 8225620
- 208 Pinehaven Dr Unit 20
- 208 Pinehaven Dr
- 204 Pinehaven Dr
- 211 Pinehaven Dr
- 210 Pinehaven Dr
- 209 Pinehaven Dr
- 202 Pinehaven Dr
- 213 Pinehaven Dr
- 213 Pinehaven Dr Unit 1
- 212 Pinehaven Dr
- 207 Pinehaven Dr
- 200 Pinehaven Dr