Estimated Value: $1,226,346
--
Bed
--
Bath
1,792
Sq Ft
$684/Sq Ft
Est. Value
About This Home
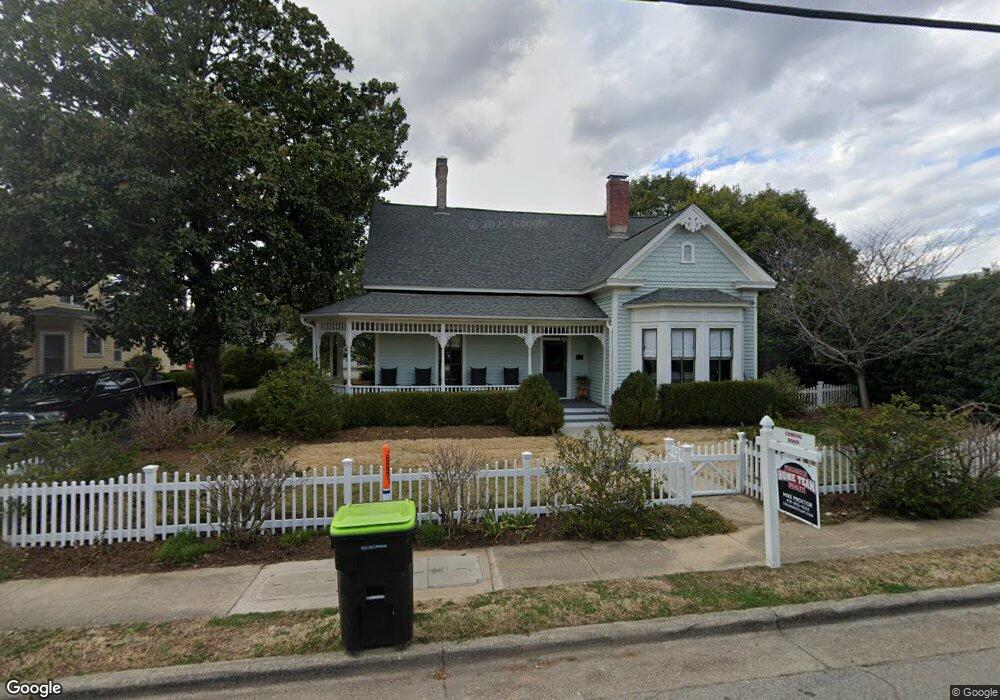
This home is located at 206 S Salem St Unit 1, Apex, NC 27502 and is currently estimated at $1,226,346, approximately $684 per square foot. 206 S Salem St Unit 1 is a home located in Wake County with nearby schools including Baucom Elementary School, Apex Middle, and Apex High School.
Ownership History
Date
Name
Owned For
Owner Type
Purchase Details
Closed on
May 8, 2025
Sold by
Shirley Augustus Graham and Shirley Kimberly B
Bought by
Joyner Jason A and Joyner Jennifer E
Current Estimated Value
Home Financials for this Owner
Home Financials are based on the most recent Mortgage that was taken out on this home.
Original Mortgage
$1,025,000
Outstanding Balance
$1,021,495
Interest Rate
6.83%
Mortgage Type
New Conventional
Estimated Equity
$204,851
Purchase Details
Closed on
Sep 26, 2017
Sold by
Shirley Ii Augustus Graham and Shirley Kimberly B
Bought by
Shirley Ii Augustus Graham and Shirley Kimberly B
Home Financials for this Owner
Home Financials are based on the most recent Mortgage that was taken out on this home.
Original Mortgage
$465,600
Interest Rate
3.89%
Mortgage Type
New Conventional
Purchase Details
Closed on
Aug 31, 2015
Sold by
Birch Robert M and Birch Kimberly B
Bought by
Shirley Augustus Graham and Shirley Kimberly B
Purchase Details
Closed on
Nov 24, 2003
Sold by
Navy Fcu
Bought by
Birch Robert M and Birch Kimberly B
Home Financials for this Owner
Home Financials are based on the most recent Mortgage that was taken out on this home.
Original Mortgage
$160,000
Interest Rate
5.97%
Mortgage Type
Construction
Create a Home Valuation Report for This Property
The Home Valuation Report is an in-depth analysis detailing your home's value as well as a comparison with similar homes in the area
Home Values in the Area
Average Home Value in this Area
Purchase History
| Date | Buyer | Sale Price | Title Company |
|---|---|---|---|
| Joyner Jason A | $1,250,000 | None Listed On Document | |
| Joyner Jason A | $1,250,000 | None Listed On Document | |
| Shirley Ii Augustus Graham | -- | None Available | |
| Shirley Augustus Graham | $320,000 | Attorney | |
| Birch Robert M | $145,000 | -- |
Source: Public Records
Mortgage History
| Date | Status | Borrower | Loan Amount |
|---|---|---|---|
| Open | Joyner Jason A | $1,025,000 | |
| Closed | Joyner Jason A | $1,025,000 | |
| Previous Owner | Shirley Ii Augustus Graham | $465,600 | |
| Previous Owner | Birch Robert M | $160,000 |
Source: Public Records
Tax History Compared to Growth
Tax History
| Year | Tax Paid | Tax Assessment Tax Assessment Total Assessment is a certain percentage of the fair market value that is determined by local assessors to be the total taxable value of land and additions on the property. | Land | Improvement |
|---|---|---|---|---|
| 2025 | $3,230 | $739,946 | $484,672 | $255,274 |
| 2024 | $3,158 | $739,946 | $484,672 | $255,274 |
| 2023 | $2,958 | $539,271 | $330,729 | $208,542 |
| 2022 | $2,776 | $539,271 | $330,729 | $208,542 |
| 2021 | $2,669 | $539,271 | $330,729 | $208,542 |
| 2020 | $2,642 | $539,271 | $330,729 | $208,542 |
| 2019 | $3,309 | $291,327 | $115,871 | $175,456 |
| 2018 | $3,115 | $291,327 | $115,871 | $175,456 |
| 2017 | $2,899 | $291,327 | $115,871 | $175,456 |
| 2016 | $2,856 | $291,327 | $115,871 | $175,456 |
| 2015 | -- | $210,489 | $82,765 | $127,724 |
| 2014 | -- | $210,489 | $82,765 | $127,724 |
Source: Public Records
Map
Nearby Homes
- 202 W Chatham St
- 307 S Elm St
- 406 S Salem St
- 410 2nd St
- 506 W Chatham St
- 309 Culvert St
- 311 Culvert St
- 105 Cunningham St
- 1434 Salem Creek Dr
- 314 Wrenn St
- 318 Glaston Ct
- 1614 Brussels Dr
- 547 Grand Central Station
- 596 Grand Central Station
- 102 Licorice Dr
- 635 Sawcut Ln
- 631 Sawcut Ln
- 633 Sawcut Ln
- 1713 Yateley Ln
- 1000 Oakgate Ct