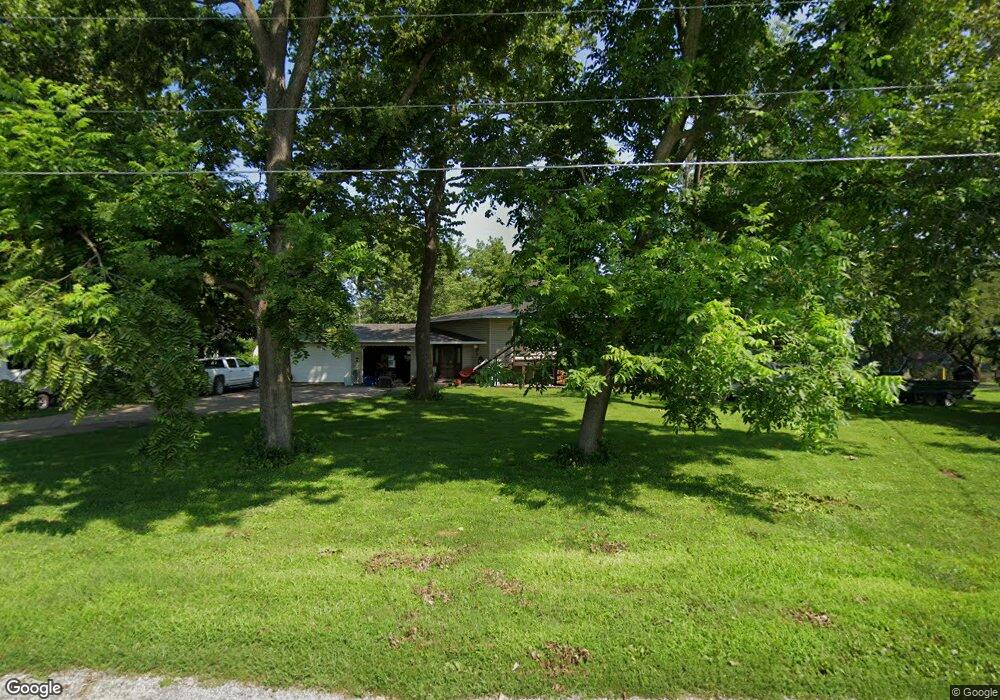
206 Spring St Wapello, IA 52653
Estimated Value: $246,000 - $265,000
4
Beds
2
Baths
2,011
Sq Ft
$127/Sq Ft
Est. Value
About This Home
This home is located at 206 Spring St, Wapello, IA 52653 and is currently estimated at $255,593, approximately $127 per square foot. 206 Spring St is a home located in Louisa County with nearby schools including Wapello Elementary School and Wapello Senior High School.
Ownership History
Date
Name
Owned For
Owner Type
Purchase Details
Closed on
Mar 4, 2022
Sold by
Eastern Iowa Light And Power Cooperative
Bought by
City Of Wapello
Current Estimated Value
Purchase Details
Closed on
Oct 5, 2016
Sold by
Dotson James L and Dotson Rosemary
Bought by
Swafford Jason A and Schelonka Shelly K
Home Financials for this Owner
Home Financials are based on the most recent Mortgage that was taken out on this home.
Original Mortgage
$102,500
Interest Rate
3.65%
Mortgage Type
Adjustable Rate Mortgage/ARM
Create a Home Valuation Report for This Property
The Home Valuation Report is an in-depth analysis detailing your home's value as well as a comparison with similar homes in the area
Home Values in the Area
Average Home Value in this Area
Purchase History
| Date | Buyer | Sale Price | Title Company |
|---|---|---|---|
| City Of Wapello | -- | None Listed On Document | |
| Swafford Jason A | $162,500 | None Available |
Source: Public Records
Mortgage History
| Date | Status | Borrower | Loan Amount |
|---|---|---|---|
| Previous Owner | Swafford Jason A | $102,500 |
Source: Public Records
Tax History Compared to Growth
Tax History
| Year | Tax Paid | Tax Assessment Tax Assessment Total Assessment is a certain percentage of the fair market value that is determined by local assessors to be the total taxable value of land and additions on the property. | Land | Improvement |
|---|---|---|---|---|
| 2025 | $3,600 | $231,260 | $30,040 | $201,220 |
| 2024 | $3,598 | $220,380 | $30,040 | $190,340 |
| 2023 | $3,598 | $219,650 | $30,040 | $189,610 |
| 2022 | $3,394 | $184,140 | $30,040 | $154,100 |
| 2021 | $3,272 | $184,140 | $30,040 | $154,100 |
| 2020 | $3,272 | $167,960 | $30,040 | $137,920 |
| 2019 | $3,256 | $167,960 | $30,040 | $137,920 |
| 2018 | $3,188 | $165,950 | $30,040 | $137,250 |
| 2017 | $3,382 | $160,500 | $0 | $0 |
| 2016 | $3,170 | $160,500 | $30,040 | $130,460 |
| 2015 | $3,170 | $160,500 | $30,040 | $130,460 |
| 2014 | $3,212 | $151,500 | $16,990 | $134,510 |
Source: Public Records
Map
Nearby Homes