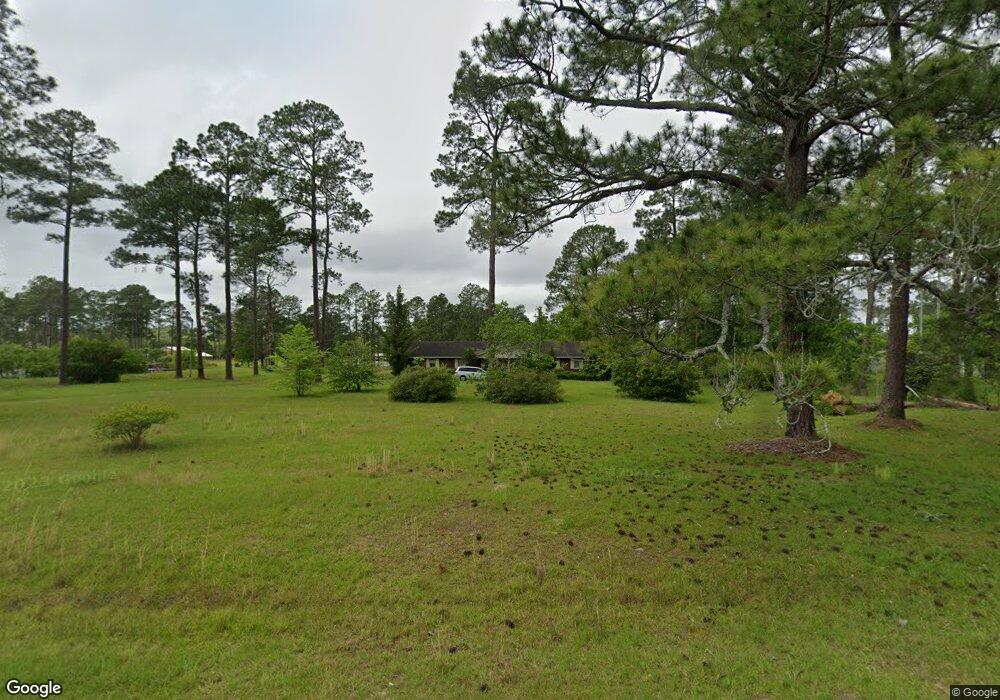
206 Tree Farm Rd Moultrie, GA 31768
Estimated Value: $274,000 - $311,000
4
Beds
2
Baths
2,557
Sq Ft
$115/Sq Ft
Est. Value
About This Home
This home is located at 206 Tree Farm Rd, Moultrie, GA 31768 and is currently estimated at $292,779, approximately $114 per square foot. 206 Tree Farm Rd is a home located in Colquitt County with nearby schools including Funston Elementary School, C.A. Gray Junior High School, and Willie J. Williams Middle School.
Ownership History
Date
Name
Owned For
Owner Type
Purchase Details
Closed on
Sep 26, 2018
Sold by
Mtglq Investors Lp
Bought by
West Frank R and West Dalena K
Current Estimated Value
Purchase Details
Closed on
Nov 3, 2014
Sold by
Jenkins Randall Freeman
Bought by
Williams Walter L
Purchase Details
Closed on
Apr 18, 2011
Sold by
Tye Holding Trust
Bought by
Jenkins Randall F
Purchase Details
Closed on
Jun 18, 2009
Sold by
Owens Trust
Bought by
Blessings From Above Trust
Purchase Details
Closed on
Jul 21, 2008
Sold by
Jenkins Randy F
Bought by
Tye Holding
Purchase Details
Closed on
Jul 20, 2007
Sold by
Walden Mary E
Bought by
Jenkins Randy F
Home Financials for this Owner
Home Financials are based on the most recent Mortgage that was taken out on this home.
Original Mortgage
$175,750
Interest Rate
6.65%
Mortgage Type
New Conventional
Purchase Details
Closed on
Mar 17, 2004
Sold by
Walden Robert
Bought by
Walden Mary E
Create a Home Valuation Report for This Property
The Home Valuation Report is an in-depth analysis detailing your home's value as well as a comparison with similar homes in the area
Purchase History
| Date | Buyer | Sale Price | Title Company |
|---|---|---|---|
| West Frank R | $126,500 | -- | |
| Williams Walter L | $174,000 | -- | |
| Jenkins Randall F | -- | -- | |
| Blessings From Above Trust | -- | -- | |
| Tye Holding | -- | -- | |
| Jenkins Randy F | $185,000 | -- | |
| Walden Mary E | -- | -- |
Source: Public Records
Mortgage History
| Date | Status | Borrower | Loan Amount |
|---|---|---|---|
| Previous Owner | Jenkins Randy F | $175,750 |
Source: Public Records
Tax History
| Year | Tax Paid | Tax Assessment Tax Assessment Total Assessment is a certain percentage of the fair market value that is determined by local assessors to be the total taxable value of land and additions on the property. | Land | Improvement |
|---|---|---|---|---|
| 2025 | $1,872 | $94,125 | $8,320 | $85,805 |
| 2024 | $1,872 | $95,186 | $8,320 | $86,866 |
| 2023 | $2,007 | $69,398 | $8,320 | $61,078 |
| 2022 | $1,337 | $56,138 | $8,320 | $47,818 |
| 2021 | $1,173 | $48,312 | $8,320 | $39,992 |
| 2020 | $1,194 | $48,312 | $8,320 | $39,992 |
| 2019 | $1,328 | $48,312 | $8,320 | $39,992 |
| 2018 | $1,781 | $69,624 | $8,320 | $61,304 |
| 2017 | $1,895 | $69,624 | $8,320 | $61,304 |
| 2016 | $1,920 | $69,624 | $8,320 | $61,304 |
| 2015 | $1,603 | $69,624 | $8,320 | $61,304 |
| 2014 | $1,902 | $69,624 | $8,320 | $61,304 |
| 2013 | -- | $69,624 | $8,320 | $61,304 |
Source: Public Records
Map
Nearby Homes
- 216 Circle Rd
- 2010 West Blvd
- 410 West Bypass NW
- 410 W Bypass Pass NW
- 1215 12th St SW
- 515 8th St SW
- 408 9th St NW
- 904 Barbara Cir
- 618 2nd Ave SW
- 722 Martin Luther King jr Dr
- 601 4th Ave SW
- 198 Westwoods Dr
- 134 Westwoods Dr
- 221 6th St SW
- 610 1st Ave NW
- 905 Barbara Cir
- 518 1st Ave SW Unit 3
- 176 Fox Trot Dr
- 1021 11th Ave NW
- 00 1st Ave SW
- 272 Tree Farm Rd
- 394 Pine Mdw Sub Rd
- 356 Pine Meadows Subdivision Rd
- 121 Pine Meadows Dr
- 105 Pine Meadows Dr
- 813 Ga Highway 111
- 833 Ga Highway 111
- 301 Tree Farm Rd
- 135 Pine Meadows Dr
- 150 Tree Farm Rd
- 156 Pine Meadows Dr
- 366 Pine Meadows Subdivision Rd
- 366 Pine Mdw Sub Rd
- 366 Pine Meadows S D
- 851 Ga Highway 111
- 316 Tree Farm Rd
- 345 Pine Mdw Sub Rd
- 828 Ga Highway 111
- 816 Ga Highway 111
- 266 Pine Meadows Subdivision Rd