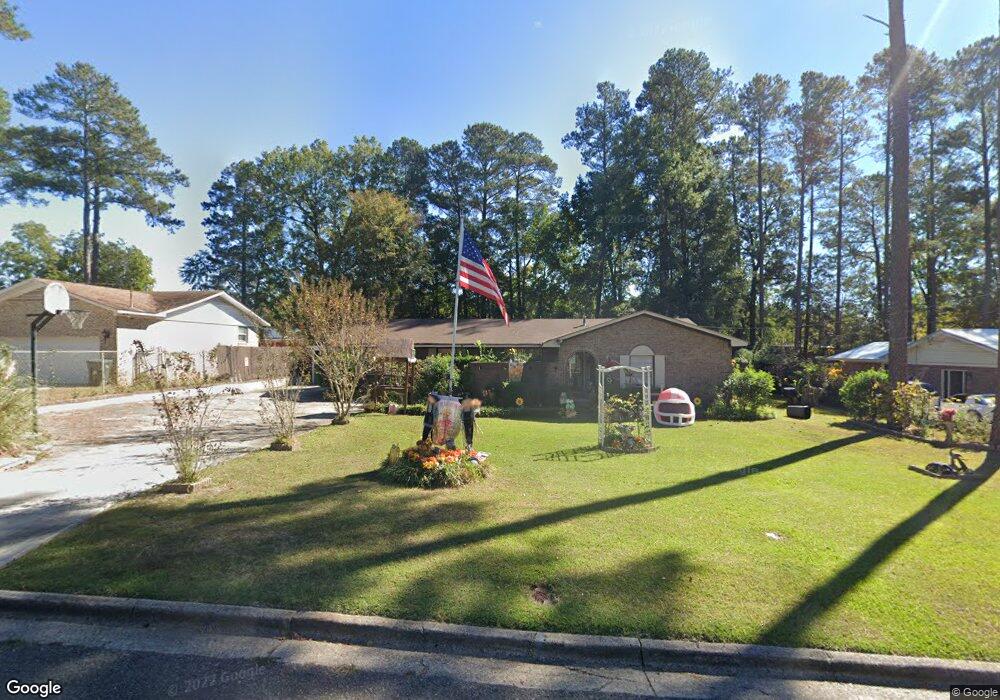
206 Tremont Way Augusta, GA 30907
Montclair NeighborhoodEstimated Value: $288,717 - $334,000
3
Beds
2
Baths
1,778
Sq Ft
$175/Sq Ft
Est. Value
About This Home
This home is located at 206 Tremont Way, Augusta, GA 30907 and is currently estimated at $310,929, approximately $174 per square foot. 206 Tremont Way is a home located in Richmond County with nearby schools including First Coast Technical Institute, R.B. Hunt Elementary School, and Warren Road Elementary School.
Ownership History
Date
Name
Owned For
Owner Type
Purchase Details
Closed on
Jun 10, 1997
Sold by
Porter Ronald E Ii Porter Darcee J
Bought by
Jones Hurley M Jones Julie B
Current Estimated Value
Purchase Details
Closed on
Jun 6, 1997
Sold by
Porter Ii Ronald E
Bought by
Jones Hurley M
Purchase Details
Closed on
Dec 29, 1992
Sold by
Stone Dearing Francis Iii Stone Clai
Bought by
Porter Ronald E Ii Porter Darcee J
Purchase Details
Closed on
Dec 28, 1992
Sold by
Stone Dearing Franc
Bought by
Porter Ii Ronald E
Purchase Details
Closed on
Nov 25, 1992
Sold by
Hummel Allan R
Bought by
Stone Dearing Francis Iii Stone Cla
Purchase Details
Closed on
Nov 6, 1992
Sold by
Hummel Allan R
Bought by
Stone Dearing Franc
Purchase Details
Closed on
Aug 6, 1990
Sold by
Hummel Colleen T
Bought by
Hummel Allan R
Purchase Details
Closed on
Oct 25, 1989
Sold by
Coclin James W
Bought by
Hummell Allan R Hummell Collenn T
Create a Home Valuation Report for This Property
The Home Valuation Report is an in-depth analysis detailing your home's value as well as a comparison with similar homes in the area
Home Values in the Area
Average Home Value in this Area
Purchase History
| Date | Buyer | Sale Price | Title Company |
|---|---|---|---|
| Jones Hurley M Jones Julie B | -- | -- | |
| Jones Hurley M | $79,000 | -- | |
| Porter Ronald E Ii Porter Darcee J | -- | -- | |
| Porter Ii Ronald E | $67,000 | -- | |
| Stone Dearing Francis Iii Stone Cla | -- | -- | |
| Stone Dearing Franc | $60,000 | -- | |
| Hummel Allan R | -- | -- | |
| Hummell Allan R Hummell Collenn T | -- | -- |
Source: Public Records
Tax History Compared to Growth
Tax History
| Year | Tax Paid | Tax Assessment Tax Assessment Total Assessment is a certain percentage of the fair market value that is determined by local assessors to be the total taxable value of land and additions on the property. | Land | Improvement |
|---|---|---|---|---|
| 2025 | $3,112 | $108,304 | $11,600 | $96,704 |
| 2024 | $3,112 | $117,328 | $11,600 | $105,728 |
| 2023 | $2,441 | $109,000 | $11,600 | $97,400 |
| 2022 | $2,232 | $75,566 | $11,600 | $63,966 |
| 2021 | $2,090 | $65,140 | $11,600 | $53,540 |
| 2020 | $2,209 | $65,140 | $11,600 | $53,540 |
| 2019 | $2,207 | $60,980 | $8,800 | $52,180 |
| 2018 | $2,057 | $55,934 | $8,800 | $47,134 |
| 2017 | $2,284 | $64,544 | $8,800 | $55,744 |
| 2016 | $2,286 | $64,544 | $8,800 | $55,744 |
| 2015 | $2,302 | $64,544 | $8,800 | $55,744 |
| 2014 | $2,305 | $64,544 | $8,800 | $55,744 |
Source: Public Records
Map
Nearby Homes
- 46 Charlestowne Dr
- 2695 York Dr
- 206 Warren Rd
- 3103 Clay Hill Dr
- 2413 Woodbluff Ct
- 3084 Westwood Rd
- 3082 Westwood Rd
- 3086 Westwood Rd
- 1405 Colony Place Dr
- 3130 Village West Dr
- 3107 Parrish Rd
- 210 Gardners Mill Rd
- 1017 Stevens Creek Rd Unit G182
- 1017 Stevens Creek Rd
- 2703 Oakbluff Ct
- 213 Kings Chapel Rd
- 1001 Windsong Cir
- 2507 Pinebluff Ct
- 2108 Turtle Ct
- 2918 Arrowhead Dr
- 204 Tremont Way
- 208 Tremont Way
- 210 Tremont Way
- 202 Tremont Way
- 205 Tremont Way
- 207 Tremont Way
- 203 Tremont Way
- 209 Tremont Way
- 212 Tremont Way
- 114 Tremont Way
- 201 Tremont Way
- 204 Charlestowne Way
- 206 Charlestowne Way
- 208 Charlestowne Way
- 202 Charlestowne Way
- 210 Charlestowne Way
- 212 Charlestowne Way
- 214 Charlestowne Way
- 1 Charlestowne Dr
- 216 Charlestowne Way