
Landlord's Agent in 2023
Marybeth Sullivan
William Raveis Real Estate
(203) 984-8025
1 in this area
23 Total Sales
Estimated Value: $749,850 - $858,000
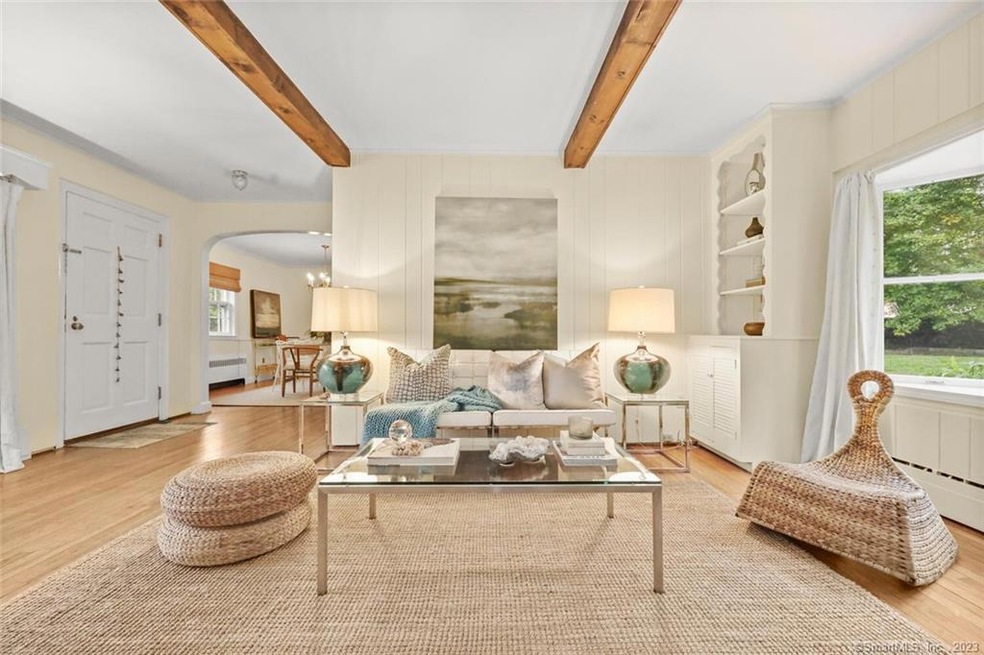
Amazing location! Just freshly painted exterior and interior. Welcome to this beautiful sun-drenched ranch situated on over half an acre. Bordering Westport in the Cranbury section of Norwalk, this happy home is located close to all the conveniences that both towns have to offer! Offering 3bedrooms and an additional room for office/gym/nursery and 2 full baths as well as a brand new CENTRAL AIR system and new roof. The spacious layout includes an eat-in-kitchen with walk-in pantry, dining room, family room and a light-filled living room with wood burning fireplace, exposed beams and hardwood floors. The home's primary bedroom with en suite bathroom has an adjacent bonus room with a private entrance for a home office, art studio, gym, fourth bedroom or nursery. The other two bedrooms and second full bath enjoy privacy of their own just off of the living room. The screened-in porch with cathedral ceilings and skylights, deck and large private backyard with fire pit are perfect for entertaining and stargazing. 2 Year Lease a possibility
Last Agent to Rent the Property
William Raveis Real Estate License #RES.0776862 Listed on: 10/15/2023
| Date | Event | Price | List to Sale | Price per Sq Ft |
|---|---|---|---|---|
| 11/22/2023 11/22/23 | Rented | $4,300 | -4.4% | -- |
| 10/22/2023 10/22/23 | Price Changed | $4,500 | -5.3% | $2 / Sq Ft |
| 10/15/2023 10/15/23 | For Rent | $4,750 | +58.3% | -- |
| 03/27/2019 03/27/19 | Rented | $3,000 | 0.0% | -- |
| 03/06/2019 03/06/19 | Price Changed | $3,000 | -7.7% | $2 / Sq Ft |
| 02/25/2019 02/25/19 | Price Changed | $3,250 | -1.5% | $2 / Sq Ft |
| 01/23/2019 01/23/19 | Price Changed | $3,300 | 0.0% | $2 / Sq Ft |
| 01/23/2019 01/23/19 | For Rent | $3,300 | +3.9% | -- |
| 01/02/2019 01/02/19 | For Rent | $3,175 | 0.0% | -- |
| 12/31/2018 12/31/18 | Off Market | $3,175 | -- | -- |
| 11/26/2018 11/26/18 | Off Market | $3,175 | -- | -- |
| 10/30/2018 10/30/18 | Price Changed | $3,175 | -3.8% | $2 / Sq Ft |
| 09/27/2018 09/27/18 | Price Changed | $3,300 | -2.8% | $2 / Sq Ft |
| 08/29/2018 08/29/18 | Price Changed | $3,395 | -1.6% | $2 / Sq Ft |
| 07/19/2018 07/19/18 | For Rent | $3,450 | +3.0% | -- |
| 09/13/2017 09/13/17 | Rented | $3,350 | 0.0% | -- |
| 07/19/2017 07/19/17 | For Rent | $3,350 | +3.1% | -- |
| 06/30/2016 06/30/16 | Rented | $3,250 | 0.0% | -- |
| 06/30/2016 06/30/16 | For Rent | $3,250 | +14.0% | -- |
| 03/15/2013 03/15/13 | Rented | $2,850 | -0.9% | -- |
| 02/13/2013 02/13/13 | Under Contract | -- | -- | -- |
| 01/24/2013 01/24/13 | For Rent | $2,875 | -- | -- |
| Year | Tax Paid | Tax Assessment Tax Assessment Total Assessment is a certain percentage of the fair market value that is determined by local assessors to be the total taxable value of land and additions on the property. | Land | Improvement |
|---|---|---|---|---|
| 2025 | $9,629 | $402,100 | $204,060 | $198,040 |
| 2024 | $9,486 | $402,100 | $204,060 | $198,040 |
| 2023 | $7,003 | $278,340 | $162,670 | $115,670 |
| 2022 | $6,873 | $278,340 | $162,670 | $115,670 |
| 2021 | $6,694 | $278,340 | $162,670 | $115,670 |
| 2020 | $6,690 | $278,340 | $162,670 | $115,670 |
| 2019 | $6,503 | $278,340 | $162,670 | $115,670 |
| 2018 | $7,282 | $273,140 | $175,390 | $97,750 |
| 2017 | $7,032 | $273,130 | $175,390 | $97,740 |
| 2016 | $6,965 | $273,140 | $175,390 | $97,750 |
| 2015 | $6,946 | $273,140 | $175,390 | $97,750 |
| 2014 | $6,856 | $273,140 | $175,390 | $97,750 |
Landlord's Agent in 2023
Marybeth Sullivan
William Raveis Real Estate
(203) 984-8025
1 in this area
23 Total Sales
Tenant's Agent in 2023
Chau Ngo
Compass Connecticut, LLC
(917) 848-0341
1 in this area
28 Total Sales
Seller's Agent in 2019
Michael Calise
Settlers & Traders
(203) 431-3333
4 Total Sales
Buyer's Agent in 2019
Nicole J Bates
William Raveis Real Estate
(203) 912-9778
1 in this area
208 Total Sales
Buyer Co-Listing Agent in 2019
Penny Schwartz
William Raveis Real Estate
(203) 253-6851
38 Total Sales
C
Buyer's Agent in 2017
Catherine Calise
Settlers & Traders
(203) 273-3314
12 Total Sales
Source: SmartMLS
MLS Number: 170603918
APN: NORW-000005-000018-000019
Disclaimer: Certain information contained herein is derived from information provided by parties other than Homes.com. All information provided is deemed reliable, but is not guaranteed to be accurate and should be independently verified.
![]() IDX information is provided exclusively for personal, non-commercial use, and may not be used for any purpose other than to identify prospective properties consumers may be interested in purchasing. Information is deemed reliable but not guaranteed.
IDX information is provided exclusively for personal, non-commercial use, and may not be used for any purpose other than to identify prospective properties consumers may be interested in purchasing. Information is deemed reliable but not guaranteed.
Ask me questions while you tour the home.