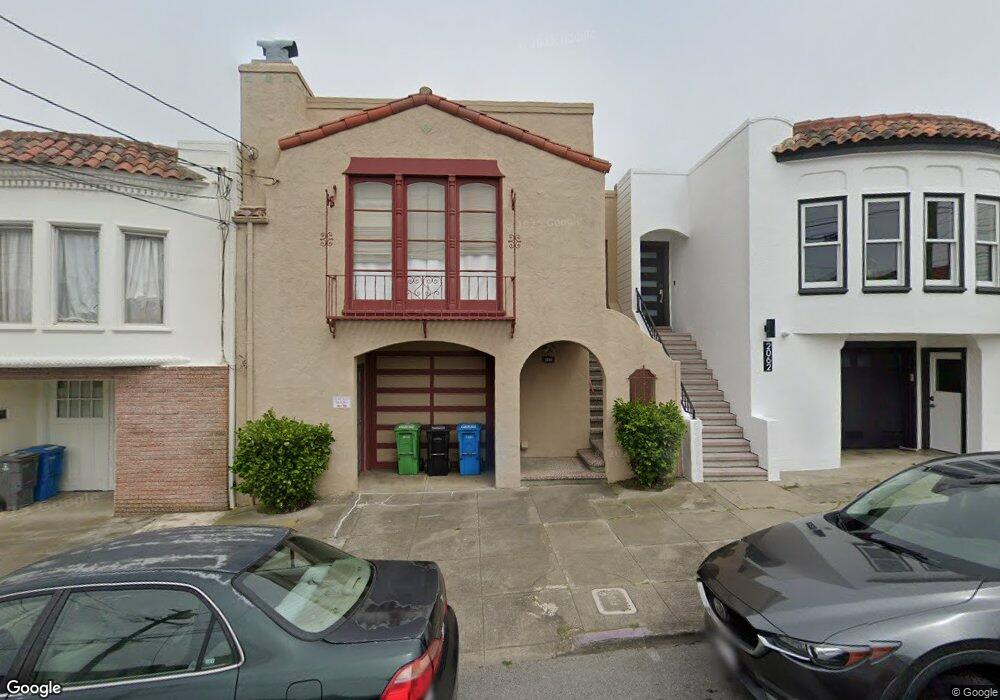
2060 20th Ave San Francisco, CA 94116
Parkside NeighborhoodEstimated Value: $1,399,000 - $1,577,000
2
Beds
1
Bath
1,500
Sq Ft
$1,002/Sq Ft
Est. Value
About This Home
This home is located at 2060 20th Ave, San Francisco, CA 94116 and is currently estimated at $1,502,932, approximately $1,001 per square foot. 2060 20th Ave is a home located in San Francisco County with nearby schools including Jefferson Elementary School, Giannini (A.P.) Middle School, and Cornerstone Academy-Lawton Campus.
Ownership History
Date
Name
Owned For
Owner Type
Purchase Details
Closed on
Sep 18, 2013
Sold by
Hsiong James C and Hsiong Sonia S
Bought by
Yan King and Fong Calvin T
Current Estimated Value
Home Financials for this Owner
Home Financials are based on the most recent Mortgage that was taken out on this home.
Original Mortgage
$350,000
Outstanding Balance
$261,800
Interest Rate
4.46%
Mortgage Type
New Conventional
Estimated Equity
$1,241,132
Purchase Details
Closed on
Sep 17, 2013
Sold by
Wong Kin Way
Bought by
Yan King
Home Financials for this Owner
Home Financials are based on the most recent Mortgage that was taken out on this home.
Original Mortgage
$350,000
Outstanding Balance
$261,800
Interest Rate
4.46%
Mortgage Type
New Conventional
Estimated Equity
$1,241,132
Purchase Details
Closed on
Feb 18, 2006
Sold by
Hsiong James C and Sung Sonia
Bought by
Hsiong James C and Hsiong Sonia S
Purchase Details
Closed on
Oct 23, 2003
Sold by
Lyle Marcia Cohn
Bought by
Hsiong James C and Sung Sonia
Home Financials for this Owner
Home Financials are based on the most recent Mortgage that was taken out on this home.
Original Mortgage
$300,000
Interest Rate
5.72%
Mortgage Type
Purchase Money Mortgage
Create a Home Valuation Report for This Property
The Home Valuation Report is an in-depth analysis detailing your home's value as well as a comparison with similar homes in the area
Home Values in the Area
Average Home Value in this Area
Purchase History
| Date | Buyer | Sale Price | Title Company |
|---|---|---|---|
| Yan King | $839,000 | Fidelity National Title Co | |
| Yan King | -- | Fidelity National Title Co | |
| Hsiong James C | -- | None Available | |
| Hsiong James C | $630,000 | North American Title Company |
Source: Public Records
Mortgage History
| Date | Status | Borrower | Loan Amount |
|---|---|---|---|
| Open | Yan King | $350,000 | |
| Previous Owner | Hsiong James C | $300,000 |
Source: Public Records
Tax History Compared to Growth
Tax History
| Year | Tax Paid | Tax Assessment Tax Assessment Total Assessment is a certain percentage of the fair market value that is determined by local assessors to be the total taxable value of land and additions on the property. | Land | Improvement |
|---|---|---|---|---|
| 2025 | $12,517 | $1,028,340 | $643,568 | $384,772 |
| 2024 | $12,517 | $1,008,178 | $630,950 | $377,228 |
| 2023 | $12,324 | $988,412 | $618,580 | $369,832 |
| 2022 | $12,082 | $969,034 | $606,452 | $362,582 |
| 2021 | $11,865 | $950,036 | $594,562 | $355,474 |
| 2020 | $11,925 | $940,296 | $588,466 | $351,830 |
| 2019 | $11,517 | $921,860 | $576,928 | $344,932 |
| 2018 | $11,128 | $903,786 | $565,616 | $338,170 |
| 2017 | $10,697 | $886,066 | $554,526 | $331,540 |
| 2016 | $10,513 | $868,694 | $543,654 | $325,040 |
| 2015 | $10,381 | $855,646 | $535,488 | $320,158 |
| 2014 | $10,107 | $838,888 | $525,000 | $313,888 |
Source: Public Records
Map
Nearby Homes
- 2114 20th Ave
- 2050 22nd Ave
- 2042 23rd Ave
- 2116 18th Ave
- 2211 19th Ave
- 1845 Pacheco St
- 701 Quintara St
- 1200 Ortega St Unit 1202
- 730 Santiago St
- 2319-2321 21st Ave
- 1983 15th Ave
- 1883-1885 16th Ave
- 2292 16th Ave
- 1815 18th Ave
- 353 Rivera St
- 2123 Funston Ave
- 2418 20th Ave Unit 101
- 634-636 Taraval St
- 1771 23rd Ave
- 2434 20th Ave