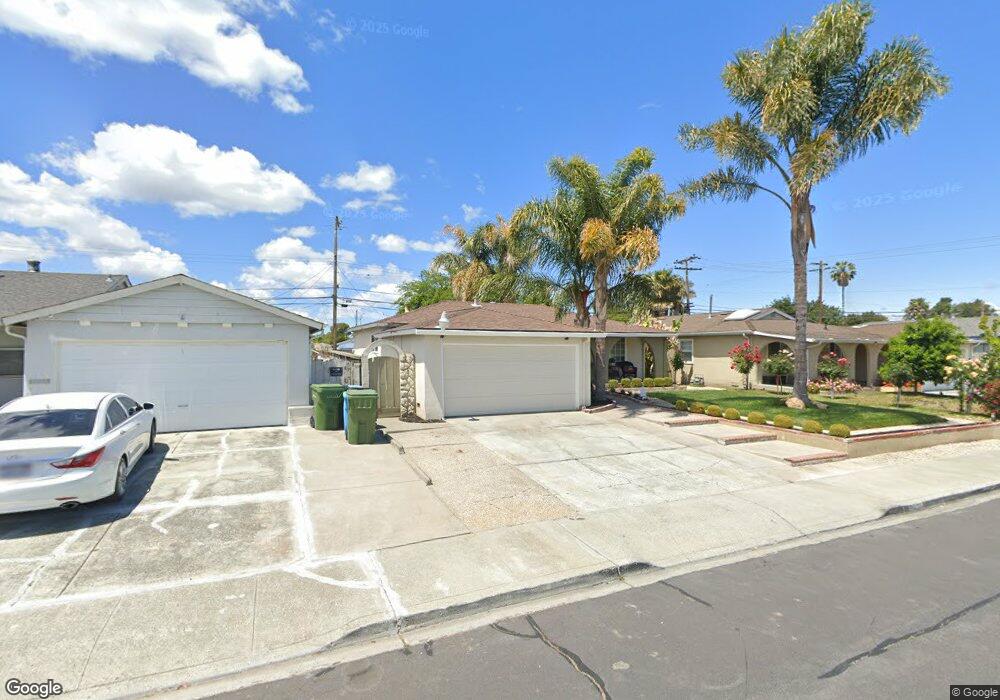
2060 Larsen Place Santa Clara, CA 95051
Estimated Value: $1,583,212 - $1,799,000
3
Beds
2
Baths
1,034
Sq Ft
$1,648/Sq Ft
Est. Value
About This Home
This home is located at 2060 Larsen Place, Santa Clara, CA 95051 and is currently estimated at $1,704,303, approximately $1,648 per square foot. 2060 Larsen Place is a home located in Santa Clara County with nearby schools including Bowers Elementary School, Juan Cabrillo Middle School, and Adrian Wilcox High School.
Ownership History
Date
Name
Owned For
Owner Type
Purchase Details
Closed on
May 11, 2017
Sold by
Dutra Mary A
Bought by
Dutra Mary A
Current Estimated Value
Purchase Details
Closed on
Nov 1, 2001
Sold by
Dutra Joseph
Bought by
Dutra Jose F and Dutra Mary A
Home Financials for this Owner
Home Financials are based on the most recent Mortgage that was taken out on this home.
Original Mortgage
$161,000
Outstanding Balance
$64,178
Interest Rate
6.99%
Estimated Equity
$1,640,125
Purchase Details
Closed on
May 11, 1995
Sold by
Pauchon Alphonse and Lopes Leland F
Bought by
Dutra Joseph
Home Financials for this Owner
Home Financials are based on the most recent Mortgage that was taken out on this home.
Original Mortgage
$168,000
Interest Rate
8.51%
Purchase Details
Closed on
Jun 29, 1994
Sold by
Peelle Financial Corp
Bought by
Pauchon Alphonse and Lopes Leland F
Create a Home Valuation Report for This Property
The Home Valuation Report is an in-depth analysis detailing your home's value as well as a comparison with similar homes in the area
Home Values in the Area
Average Home Value in this Area
Purchase History
| Date | Buyer | Sale Price | Title Company |
|---|---|---|---|
| Dutra Mary A | -- | None Available | |
| Dutra Jose F | -- | -- | |
| Dutra Joseph | $210,000 | Santa Clara Land Title Compa | |
| Pauchon Alphonse | $172,186 | North American Title Company |
Source: Public Records
Mortgage History
| Date | Status | Borrower | Loan Amount |
|---|---|---|---|
| Open | Dutra Jose F | $161,000 | |
| Closed | Dutra Joseph | $168,000 |
Source: Public Records
Tax History Compared to Growth
Tax History
| Year | Tax Paid | Tax Assessment Tax Assessment Total Assessment is a certain percentage of the fair market value that is determined by local assessors to be the total taxable value of land and additions on the property. | Land | Improvement |
|---|---|---|---|---|
| 2025 | $4,161 | $352,705 | $209,948 | $142,757 |
| 2024 | $4,161 | $345,790 | $205,832 | $139,958 |
| 2023 | $4,119 | $339,011 | $201,797 | $137,214 |
| 2022 | $4,054 | $332,365 | $197,841 | $134,524 |
| 2021 | $4,036 | $325,849 | $193,962 | $131,887 |
| 2020 | $3,963 | $322,509 | $191,974 | $130,535 |
| 2019 | $3,959 | $316,186 | $188,210 | $127,976 |
| 2018 | $3,709 | $309,987 | $184,520 | $125,467 |
| 2017 | $3,689 | $303,909 | $180,902 | $123,007 |
| 2016 | $3,656 | $297,951 | $177,355 | $120,596 |
| 2015 | $3,642 | $293,476 | $174,691 | $118,785 |
| 2014 | $3,452 | $287,729 | $171,270 | $116,459 |
Source: Public Records
Map
Nearby Homes
- 2191 Bowers Ave
- 3050 Machado Ave
- 2468 Poett Ln
- 2028 Staats Way
- 2576 Knightsbridge Ln
- 2331 Castro Place
- 2038 Kington Place
- 2272 Cabrillo Ave
- 3079 El Camino Real Unit 101
- 3079 El Camino Real Unit 205
- 3079 El Camino Real Unit 202
- 3089 El Camino Real Unit 9
- 3089 El Camino Real Unit 7
- 3089 El Camino Real Unit 5
- 3089 El Camino Real Unit 11
- 2516 Parkland Ct
- 2514 Parkland Ct
- 2785 Ball Place Unit 4
- 1400 Bowe Ave Unit 801
- 2250 Monroe St Unit 201
- 2050 Larsen Place
- 2070 Larsen Place
- 2071 Bowers Ave
- 2040 Larsen Place
- 2061 Bowers Ave
- 2081 Bowers Ave
- 2080 Larsen Place
- 2051 Bowers Ave
- 2069 Larsen Place
- 2079 Larsen Place
- 2091 Bowers Ave
- 2059 Larsen Place
- 2030 Larsen Place
- 2059 Larsen Ct
- 2089 Larsen Place
- 2041 Bowers Ave
- 2020 Larsen Place
- 2049 Larsen Ct
- 2039 Larsen Place
- 2031 Bowers Ave