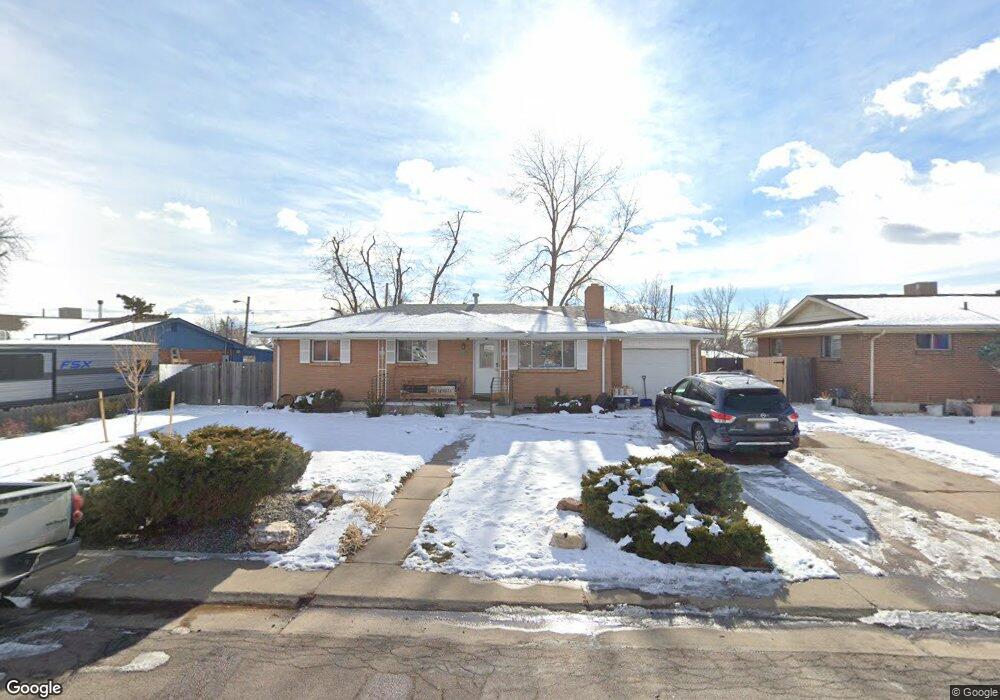
2060 Sherrelwood Dr Denver, CO 80221
Sherrelwood NeighborhoodEstimated Value: $422,308 - $529,000
2
Beds
2
Baths
1,050
Sq Ft
$460/Sq Ft
Est. Value
About This Home
This home is located at 2060 Sherrelwood Dr, Denver, CO 80221 and is currently estimated at $482,827, approximately $459 per square foot. 2060 Sherrelwood Dr is a home located in Adams County with nearby schools including Metropolitan Arts Academy, Iver C. Ranum Middle School, and Westminster High School.
Ownership History
Date
Name
Owned For
Owner Type
Purchase Details
Closed on
Sep 27, 2018
Sold by
Sally L Mcquarrie
Bought by
Simental Alejandra
Current Estimated Value
Home Financials for this Owner
Home Financials are based on the most recent Mortgage that was taken out on this home.
Original Mortgage
$339,403
Outstanding Balance
$297,357
Interest Rate
4.72%
Estimated Equity
$185,470
Purchase Details
Closed on
Jun 10, 2016
Sold by
Roybal Anthony R
Bought by
Martinez David
Purchase Details
Closed on
Jan 30, 2008
Sold by
The Harriet E Earley Trust
Bought by
Roybal Anthony R
Home Financials for this Owner
Home Financials are based on the most recent Mortgage that was taken out on this home.
Original Mortgage
$166,388
Interest Rate
6.15%
Mortgage Type
FHA
Purchase Details
Closed on
Jan 12, 2007
Sold by
Horgan George B and Houston Melodee J
Bought by
Horgan Jeanette M
Create a Home Valuation Report for This Property
The Home Valuation Report is an in-depth analysis detailing your home's value as well as a comparison with similar homes in the area
Home Values in the Area
Average Home Value in this Area
Purchase History
| Date | Buyer | Sale Price | Title Company |
|---|---|---|---|
| Simental Alejandra | $349,900 | -- | |
| Martinez David | -- | None Available | |
| Roybal Anthony R | $169,000 | None Available | |
| Horgan Jeanette M | -- | None Available |
Source: Public Records
Mortgage History
| Date | Status | Borrower | Loan Amount |
|---|---|---|---|
| Open | Simental Alejandra | $339,403 | |
| Closed | Simental Alejandra | -- | |
| Previous Owner | Roybal Anthony R | $166,388 |
Source: Public Records
Tax History Compared to Growth
Tax History
| Year | Tax Paid | Tax Assessment Tax Assessment Total Assessment is a certain percentage of the fair market value that is determined by local assessors to be the total taxable value of land and additions on the property. | Land | Improvement |
|---|---|---|---|---|
| 2024 | $3,157 | $27,130 | $5,500 | $21,630 |
| 2023 | $3,151 | $30,840 | $5,610 | $25,230 |
| 2022 | $3,022 | $24,670 | $5,770 | $18,900 |
| 2021 | $3,080 | $24,670 | $5,770 | $18,900 |
| 2020 | $2,927 | $23,770 | $5,930 | $17,840 |
| 2019 | $2,835 | $23,770 | $5,930 | $17,840 |
| 2018 | $2,229 | $18,590 | $5,400 | $13,190 |
| 2017 | $1,948 | $18,590 | $5,400 | $13,190 |
| 2016 | $1,611 | $14,590 | $2,950 | $11,640 |
| 2015 | $1,695 | $14,590 | $2,950 | $11,640 |
| 2014 | $1,494 | $12,940 | $2,390 | $10,550 |
Source: Public Records
Map
Nearby Homes
- 8188 Pecos Way
- 2200 W 82nd Place
- 8247 Vanguard Dr
- 7918 Tejon St
- 2420 W 82nd Place Unit F
- 2420 W 80th Ave
- 2430 W 82nd Place Unit 2F
- 8330 Zuni St Unit 209
- 8330 Zuni St Unit 212
- 8330 Zuni St Unit 101
- 8330 Zuni St Unit 109
- 8330 Zuni St Unit 117
- 7875 Cyd Dr
- 7820 Tejon St
- 7836 Vallejo St
- 8361 Wyandot St
- 7819 Tejon St
- 7898 Applewood Ln
- 8028 Bryant St
- 7956 Osage St
- 2080 Sherrelwood Dr
- 2040 Sherrelwood Dr
- 8086 Florado St
- 2120 Sherrelwood Dr
- 8135 Umatilla St
- 2080 Sherrelwood Cir
- 2090 Sherrelwood Cir
- 8142 Umatilla St
- 2140 Sherrelwood Dr
- 8134 Vallejo St
- 2041 Sherrelwood Dr
- 8145 Umatilla St
- 2060 Sherrelwood Cir
- 2111 Wyandot Dr
- 8131 Tejon Ct
- 8144 Vallejo St
- 8152 Umatilla St
- 2160 Sherrelwood Dr
- 8060 Florado St
- 2040 Sherrelwood Cir