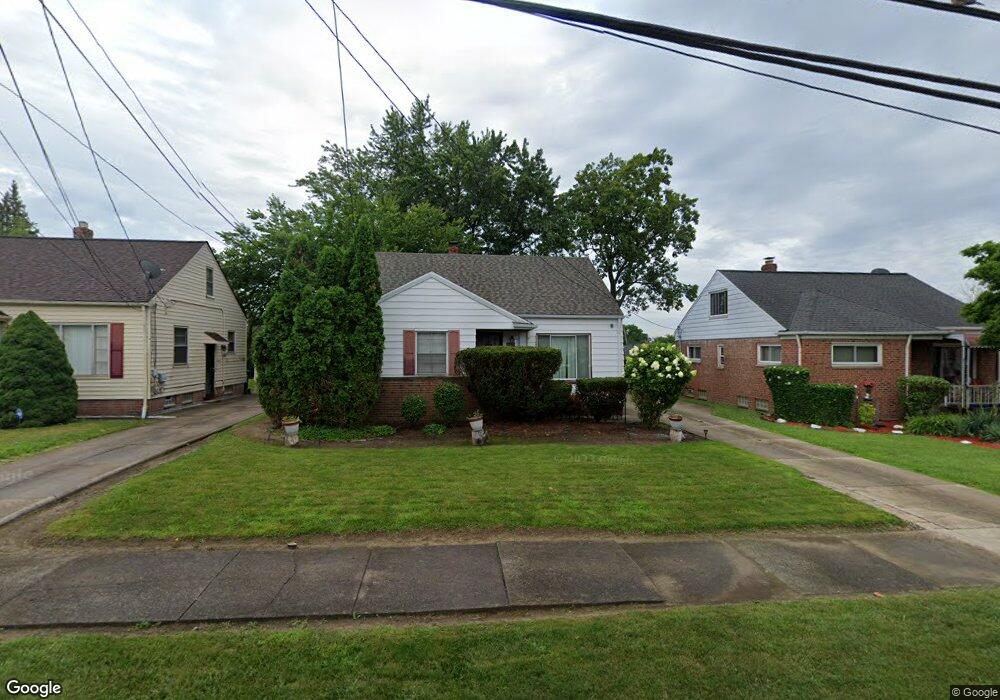
20608 Applegate Rd Maple Heights, OH 44137
Estimated Value: $129,000 - $143,000
3
Beds
2
Baths
1,248
Sq Ft
$108/Sq Ft
Est. Value
About This Home
This home is located at 20608 Applegate Rd, Maple Heights, OH 44137 and is currently estimated at $134,292, approximately $107 per square foot. 20608 Applegate Rd is a home located in Cuyahoga County with nearby schools including Abraham Lincoln Elementary School, Rockside/ J.F. Kennedy School, and Barack Obama School.
Ownership History
Date
Name
Owned For
Owner Type
Purchase Details
Closed on
Feb 23, 2005
Sold by
Hud
Bought by
Lynch Ricky C and Lynch Chriscelle
Current Estimated Value
Home Financials for this Owner
Home Financials are based on the most recent Mortgage that was taken out on this home.
Original Mortgage
$84,322
Outstanding Balance
$43,286
Interest Rate
5.8%
Mortgage Type
FHA
Estimated Equity
$91,006
Purchase Details
Closed on
Mar 29, 2004
Sold by
David Earnestine M
Bought by
Hud
Purchase Details
Closed on
Aug 25, 1995
Sold by
Fiala James B
Bought by
David Robert E and David Earnestine M
Home Financials for this Owner
Home Financials are based on the most recent Mortgage that was taken out on this home.
Original Mortgage
$77,761
Interest Rate
7.43%
Mortgage Type
FHA
Purchase Details
Closed on
Jan 1, 1975
Bought by
Fiala James B and Fiala Margaret E
Create a Home Valuation Report for This Property
The Home Valuation Report is an in-depth analysis detailing your home's value as well as a comparison with similar homes in the area
Home Values in the Area
Average Home Value in this Area
Purchase History
| Date | Buyer | Sale Price | Title Company |
|---|---|---|---|
| Lynch Ricky C | $77,000 | Lakeside | |
| Hud | $65,334 | -- | |
| David Robert E | $77,900 | -- | |
| Fiala James B | -- | -- |
Source: Public Records
Mortgage History
| Date | Status | Borrower | Loan Amount |
|---|---|---|---|
| Open | Lynch Ricky C | $84,322 | |
| Previous Owner | David Robert E | $77,761 |
Source: Public Records
Tax History
| Year | Tax Paid | Tax Assessment Tax Assessment Total Assessment is a certain percentage of the fair market value that is determined by local assessors to be the total taxable value of land and additions on the property. | Land | Improvement |
|---|---|---|---|---|
| 2024 | $3,716 | $40,460 | $7,000 | $33,460 |
| 2023 | $2,924 | $27,270 | $4,620 | $22,650 |
| 2022 | $2,913 | $27,265 | $4,620 | $22,645 |
| 2021 | $3,112 | $27,270 | $4,620 | $22,650 |
| 2020 | $2,648 | $20,650 | $3,500 | $17,150 |
| 2019 | $2,635 | $59,000 | $10,000 | $49,000 |
| 2018 | $2,622 | $20,650 | $3,500 | $17,150 |
| 2017 | $2,651 | $20,450 | $3,470 | $16,980 |
| 2016 | $2,563 | $20,450 | $3,470 | $16,980 |
| 2015 | $2,582 | $20,450 | $3,470 | $16,980 |
| 2014 | $2,582 | $22,480 | $3,820 | $18,660 |
Source: Public Records
Map
Nearby Homes
- 19113 Watercrest Ave
- 339 Grand Blvd
- 419 Center Rd
- 54 Willard Ave
- 123 Willard Ave
- 0 Hubbell Cir
- 54 Hubbell Way
- 66 Hubbell Way
- 58 Hubbell Way
- 62 Hubbell Way
- 61 Hubbell Way
- 57 Hubbell Way
- 19289 Stafford Ave
- 21202 Gardenview Dr
- 20806 Clare Ave
- 21607 Libby Rd
- 131 Noran Cir
- 18811 Waterbury Ave
- 19520 Maple Heights Blvd
- 18717 Waterbury Ave
- 20612 Applegate Rd
- 20604 Applegate Rd
- 20616 Applegate Rd
- 20600 Applegate Rd
- 20620 Applegate Rd
- 20613 Centuryway Rd
- 20603 Donny Brook Rd
- 20611 Donny Brook Rd
- 20618 Centurway
- 20618 Centuryway Rd
- 20599 Donny Brook Rd
- 20615 Donny Brook Rd
- 20624 Applegate Rd
- 20617 Centuryway Rd
- 20619 Donny Brook Rd
- 20622 Centuryway Rd
- 20628 Applegate Rd
- 20623 Donny Brook Rd
- 20621 Centuryway Rd
- 20629 Bowling Green Rd
Your Personal Tour Guide
Ask me questions while you tour the home.