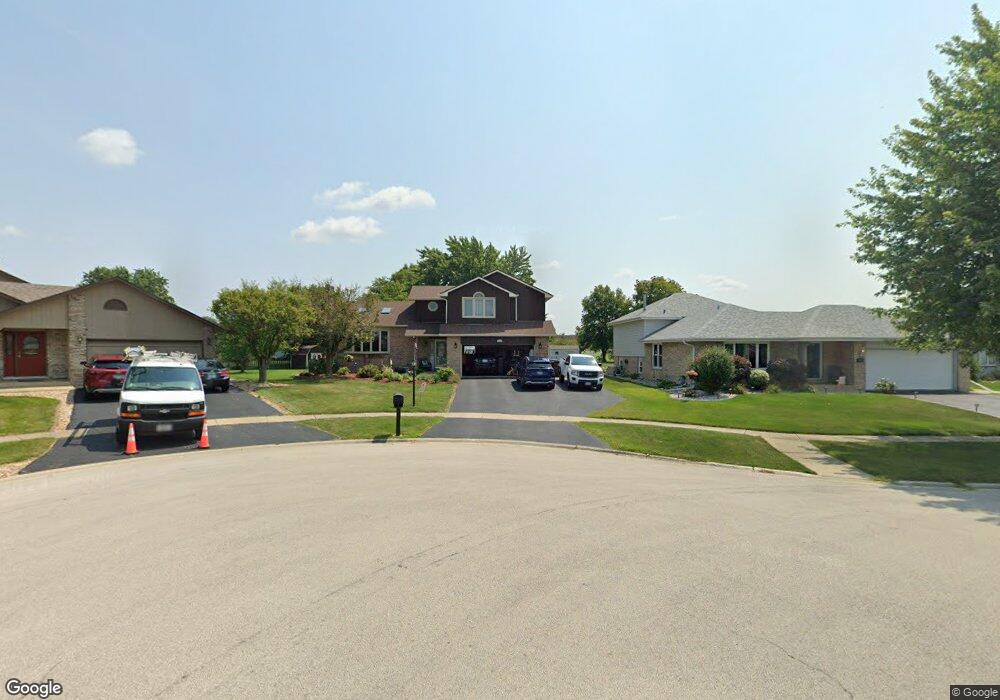
20609 S Ivy Path Frankfort, IL 60423
Frankfort Square NeighborhoodEstimated Value: $463,730 - $482,000
3
Beds
3
Baths
2,426
Sq Ft
$195/Sq Ft
Est. Value
About This Home
This home is located at 20609 S Ivy Path, Frankfort, IL 60423 and is currently estimated at $472,933, approximately $194 per square foot. 20609 S Ivy Path is a home located in Will County with nearby schools including Indian Trail Elementary School, Summit Hill Junior High School, and Lincoln-Way East High School.
Ownership History
Date
Name
Owned For
Owner Type
Purchase Details
Closed on
Apr 24, 2021
Sold by
Kusinski Dawn M
Bought by
Kusinski Dawn M
Current Estimated Value
Home Financials for this Owner
Home Financials are based on the most recent Mortgage that was taken out on this home.
Original Mortgage
$259,000
Outstanding Balance
$234,772
Interest Rate
3.25%
Mortgage Type
New Conventional
Estimated Equity
$238,161
Purchase Details
Closed on
May 24, 2017
Sold by
Roemer Lisa A and Roemer Daniel
Bought by
Kusinski Dawn M
Home Financials for this Owner
Home Financials are based on the most recent Mortgage that was taken out on this home.
Original Mortgage
$274,500
Interest Rate
4.5%
Mortgage Type
New Conventional
Purchase Details
Closed on
Jul 8, 2005
Sold by
Fitzsimmons Robert and Fitzsimmons Maureen
Bought by
Roemer Daniel
Home Financials for this Owner
Home Financials are based on the most recent Mortgage that was taken out on this home.
Original Mortgage
$239,000
Interest Rate
5.71%
Mortgage Type
Fannie Mae Freddie Mac
Create a Home Valuation Report for This Property
The Home Valuation Report is an in-depth analysis detailing your home's value as well as a comparison with similar homes in the area
Home Values in the Area
Average Home Value in this Area
Purchase History
| Date | Buyer | Sale Price | Title Company |
|---|---|---|---|
| Kusinski Dawn M | -- | Chicago Title | |
| Kusinski Dawn M | $305,000 | Attorney | |
| Roemer Daniel | $325,000 | First American Title Ins Co |
Source: Public Records
Mortgage History
| Date | Status | Borrower | Loan Amount |
|---|---|---|---|
| Open | Kusinski Dawn M | $259,000 | |
| Closed | Kusinski Dawn M | $274,500 | |
| Previous Owner | Roemer Daniel | $239,000 |
Source: Public Records
Tax History Compared to Growth
Tax History
| Year | Tax Paid | Tax Assessment Tax Assessment Total Assessment is a certain percentage of the fair market value that is determined by local assessors to be the total taxable value of land and additions on the property. | Land | Improvement |
|---|---|---|---|---|
| 2024 | $11,011 | $138,542 | $24,637 | $113,905 |
| 2023 | $11,011 | $123,731 | $22,003 | $101,728 |
| 2022 | $9,742 | $112,698 | $20,041 | $92,657 |
| 2021 | $9,134 | $105,433 | $18,749 | $86,684 |
| 2020 | $8,994 | $102,462 | $18,221 | $84,241 |
| 2019 | $8,695 | $99,719 | $17,733 | $81,986 |
| 2018 | $8,376 | $96,852 | $17,223 | $79,629 |
| 2017 | $8,200 | $94,591 | $16,821 | $77,770 |
| 2016 | $7,947 | $91,348 | $16,244 | $75,104 |
| 2015 | $7,662 | $88,131 | $15,672 | $72,459 |
| 2014 | $7,662 | $87,518 | $15,563 | $71,955 |
| 2013 | $7,662 | $88,653 | $15,765 | $72,888 |
Source: Public Records
Map
Nearby Homes
- 20513 S Acorn Ridge Dr
- 20552 S Frankfort Square Rd
- 7639 W Juniper Ct
- 7257 W Hickory Creek Dr
- 7626 W Hickory Creek Dr
- 20349 S Green Meadow Ln
- 20347 S Grand Prairie Ln
- 7223 W Mathews Dr
- 20729 S Hickory Creek Ct
- 20206 S Frankfort Square Rd Unit A
- 7752 W Almond Ct Unit 135
- 20130 S Frankfort Square Rd
- 20216 S Greenfield Ln
- 20137 S Hampton Ct Unit A
- 7758 W Kingston Dr
- 7800 W Kingston Dr
- 21257 S 79th Ave
- 8237 Auburn Ln
- 21375 Georgetown Rd
- 20027 S Jessica Ln
- 20615 S Ivy Path
- 20605 S Ivy Path Unit 2
- 20621 S Ivy Path
- 7454 W Haystack Dr Unit 2
- 20560 S Grand Prairie Ln
- 7449 W Wishing Well Dr
- 20632 S Ivy Path
- 20554 S Grand Prairie Ln
- 7462 W Haystack Dr Unit 2
- 20618 S Ivy Path Unit 2
- 7453 W Wishing Well Dr
- 7415 W Dove Ln
- 20637 S Ivy Path
- 7504 W Haystack Dr Unit 2
- 7503 W Haystack Dr Unit 2
- 20539 S White Fence Ct
- 7461 W Wishing Well Dr
- 20544 S Grand Prairie Ln
- 7462 W Silo Dr Unit 2
- 7407 W Dove Ln