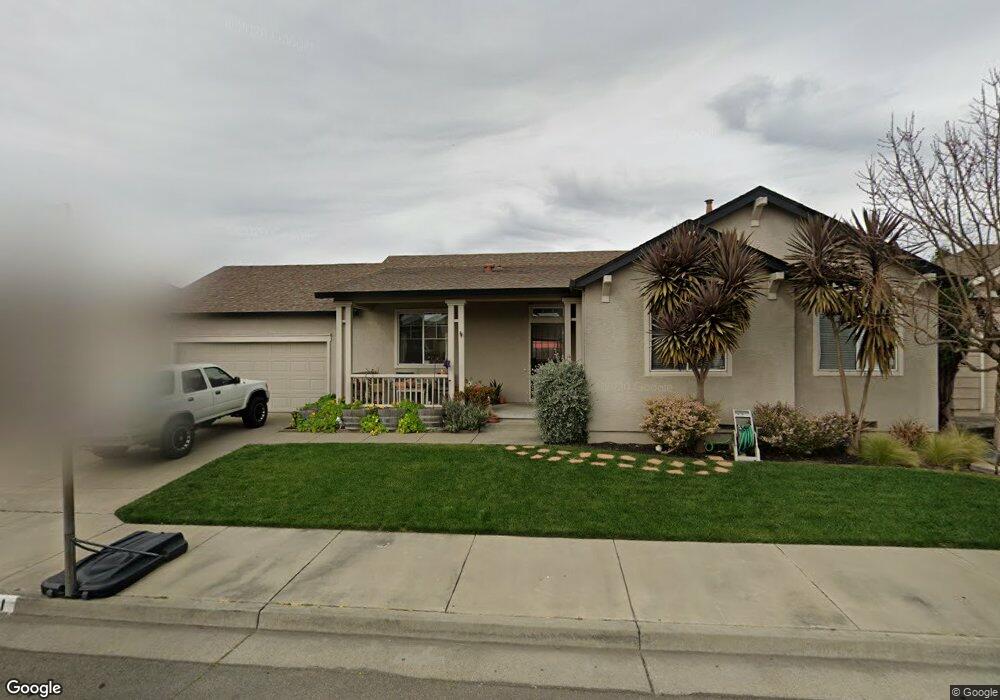
2061 Banjo Dr Santa Rosa, CA 95407
Estimated Value: $653,796 - $689,000
3
Beds
2
Baths
1,343
Sq Ft
$499/Sq Ft
Est. Value
About This Home
This home is located at 2061 Banjo Dr, Santa Rosa, CA 95407 and is currently estimated at $670,699, approximately $499 per square foot. 2061 Banjo Dr is a home located in Sonoma County with nearby schools including Elsie Allen High School and St. Michael's Orthodox School.
Ownership History
Date
Name
Owned For
Owner Type
Purchase Details
Closed on
Feb 21, 2020
Sold by
Sousa Robby and Sousa Brieanna
Bought by
Sousa Brieanna R
Current Estimated Value
Home Financials for this Owner
Home Financials are based on the most recent Mortgage that was taken out on this home.
Original Mortgage
$423,000
Outstanding Balance
$372,877
Interest Rate
3.37%
Mortgage Type
New Conventional
Estimated Equity
$297,822
Purchase Details
Closed on
Nov 9, 2001
Sold by
Narberes Gary Allen and Narberes Christina Janell
Bought by
Sousa Robby and Sousa Brieanna
Home Financials for this Owner
Home Financials are based on the most recent Mortgage that was taken out on this home.
Original Mortgage
$248,000
Interest Rate
6.62%
Purchase Details
Closed on
Dec 29, 1997
Sold by
Bellevue Ranch Associates Llc
Bought by
Narberes Gary Allen and Narberes Christina Janell
Home Financials for this Owner
Home Financials are based on the most recent Mortgage that was taken out on this home.
Original Mortgage
$164,571
Interest Rate
7.16%
Mortgage Type
FHA
Create a Home Valuation Report for This Property
The Home Valuation Report is an in-depth analysis detailing your home's value as well as a comparison with similar homes in the area
Home Values in the Area
Average Home Value in this Area
Purchase History
| Date | Buyer | Sale Price | Title Company |
|---|---|---|---|
| Sousa Brieanna R | -- | Fidelity National Title Co | |
| Sousa Robby | $310,000 | Old Republic Title Company | |
| Narberes Gary Allen | $183,000 | North American Title Co |
Source: Public Records
Mortgage History
| Date | Status | Borrower | Loan Amount |
|---|---|---|---|
| Open | Sousa Brieanna R | $423,000 | |
| Closed | Sousa Robby | $248,000 | |
| Previous Owner | Narberes Gary Allen | $164,571 | |
| Closed | Sousa Robby | $46,500 |
Source: Public Records
Tax History Compared to Growth
Tax History
| Year | Tax Paid | Tax Assessment Tax Assessment Total Assessment is a certain percentage of the fair market value that is determined by local assessors to be the total taxable value of land and additions on the property. | Land | Improvement |
|---|---|---|---|---|
| 2025 | $5,290 | $457,953 | $199,428 | $258,525 |
| 2024 | $5,290 | $448,974 | $195,518 | $253,456 |
| 2023 | $5,290 | $440,172 | $191,685 | $248,487 |
| 2022 | $5,164 | $431,542 | $187,927 | $243,615 |
| 2021 | $5,110 | $423,082 | $184,243 | $238,839 |
| 2020 | $4,963 | $418,744 | $182,354 | $236,390 |
| 2019 | $4,903 | $410,534 | $178,779 | $231,755 |
| 2018 | $4,864 | $402,485 | $175,274 | $227,211 |
| 2017 | $4,747 | $394,594 | $171,838 | $222,756 |
| 2016 | $4,688 | $386,858 | $168,469 | $218,389 |
| 2015 | $4,541 | $381,048 | $165,939 | $215,109 |
| 2014 | $4,108 | $350,000 | $152,000 | $198,000 |
Source: Public Records
Map
Nearby Homes
- 2632 Wild Bill Way
- 2599 Silver Spur Dr
- 2630 Arrowhead Dr
- 2622 Arrowhead Dr
- 2863 Liscum St
- 2912 Liscum St
- 2716 Amora Cir
- Plan 2 at Grove Village
- Plan 4 at Grove Village
- Plan 5 at Grove Village
- Plan 1 at Grove Village
- Plan 6 at Grove Village
- 2928 Liscum St
- 2931 Liscum St
- 2766 Sassy St
- 2778 Sassy St
- 2771 Sassy St
- 2786 Sassy St
- 2779 Sassy St
- 2790 Sassy St
- 2057 Banjo Dr
- 2004 Blacksmith Way
- 2065 Banjo Dr
- 2000 Blacksmith Way
- 2008 Blacksmith Way
- 2064 Banjo Dr
- 2060 Banjo Dr
- 2589 Silver Spur Dr
- 2069 Banjo Dr
- 2073 Banjo Dr
- 2012 Blacksmith Way
- 2078 Banjo Dr
- 2077 Banjo Dr
- 2591 Silver Spur Dr
- 2584 Silver Spur Dr
- 2053 Banjo Dr
- 2575 Silver Spur Dr
- 2650 Wild Bill Way
- 2081 Banjo Dr
- 2082 Banjo Dr